
How do you actually use the data out there to determine your chances out there? I see the news cover confirmed cases and deaths but how does this actually translate into understanding what are your chances of bumping into someone with this invisible virus when you go grocery shopping?
In order to help solve this mystery, the first step is figuring out how many *currently* infected people there are on a given date. This would represent the “I” in the SIR model that epidemiologists often refer to. Unfortunately, I could not find one news or academic source that provides the actual “I” for COVID-19 and where we are at.
Confirmed Cases are not “I”. Active Cases are not “I”. Hospitalized are not “I”. Not entirely anyway. There are infected people that are asymptomatic. There are symptomatic people that haven’t been tested yet but are unknowingly spreading the virus. There are those that wanted to be tested but weren’t able to for whatever reason.
As it turns out, it’s kind of difficult to solve for “I” since we don’t have widespread or robust random viral testing (still…). In order to come up with “I”, you have to make assumptions based on the limited amount of [clean] data on COVID out there.
Furthermore, people that end up being a confirmed and an “active” case are not out there spreading since they are in quarantine, in theory. So, using “active” cases tells you nothing about what YOUR risks of catching COVID-19 are. So instead, we have absolutely no way of conceptualizing our risks.
What we need to know is the people that are pre-symptomatic, pre-confirmed, or asymptomatic. Then you need to only count them on the days they are out there spreading the virus. I will call these people “Spreaders”. Only then will you have an idea of your true risks when walking around the supermarket.
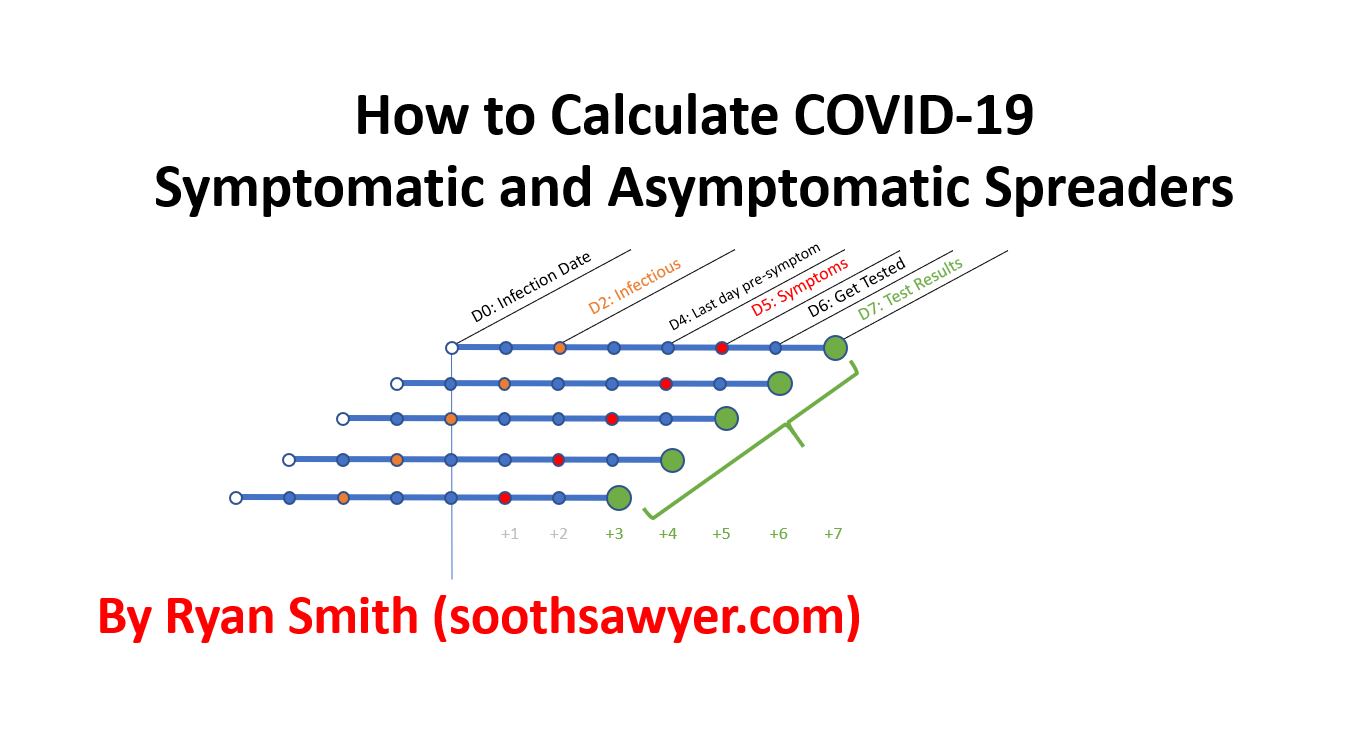
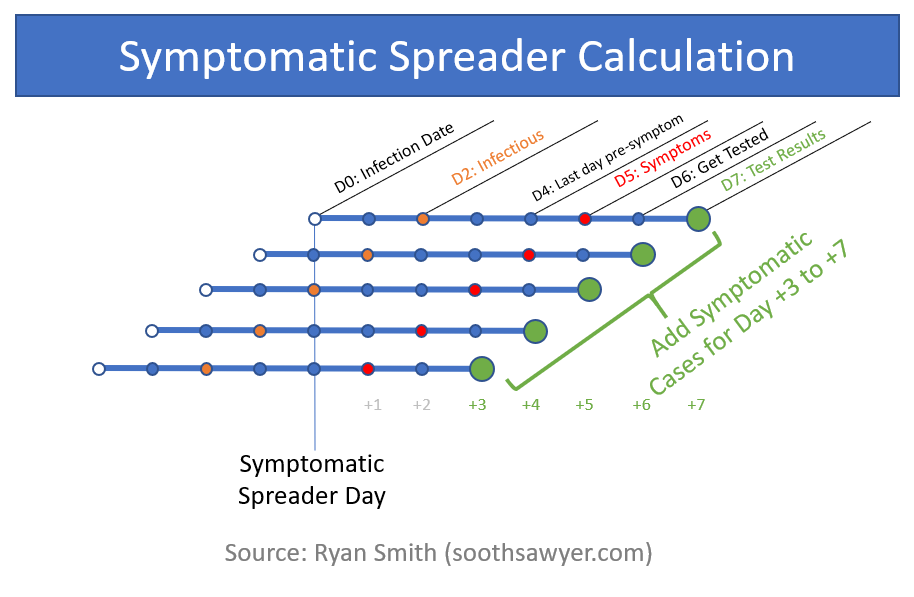
How to calculate Spreaders
Let’s tackle the symptomatic spreaders first. The best view we have into symptomatic spreaders is confirmed cases. However, not everyone gets tested so I adjust for that by assuming a normalized 3.6% CFR (Case Fatality Rate; cum. cases divided by cum. deaths). I picked this based on comparing numerous antibody studies vs confirmed cases vs deaths. You can view my raw notes for details and links to third party sources. You can view how I calculate a symptomatic case in the “Calculations” section below. A symptomatic spreader is essentially looking at someone that gets diagnosed 3-7 days (5 days) after the date being looked at. This basically counts a person on the date they get infected to the date they get symptoms. Most analysis points to only three days of infectious spreading before getting symptoms so I’m being generous in my calculation by including “D0” and “D1” (see chart). This also assumes people will self-isolate once they become aware they have it. Please review the diagram below to help visualize this calculation.
Next, I will tackle asymptomatic spreaders. For this, I assume 78% of people with COVID-19 are asymptomatic. Wow, that’s high. Well, this is what I believe based on random antibody results vs confirmed cases, various papers published around asymptomatic rates (e.g., US prisoners, New York antibody tests, Navy ship, Scripps research, NY pregnant women, Chinese study published on BMJ). You can view my raw notes for links on this. You think this is too high? Go to the bottom of this article to see the impact of your disagreement.
Asymptomatic spreaders are worse than symptomatic spreaders because they are spreading for a longer period of time since they don’t know they have it. Symptomatic were only spreading for 5 days where Asymptomatic spread for 15 days. For this, I picked -7 to +7 days from the day we are looking at. I could have picked 0 to 14 but for this one there is no set date so I decided to split it evenly before and after the date we are looking at.
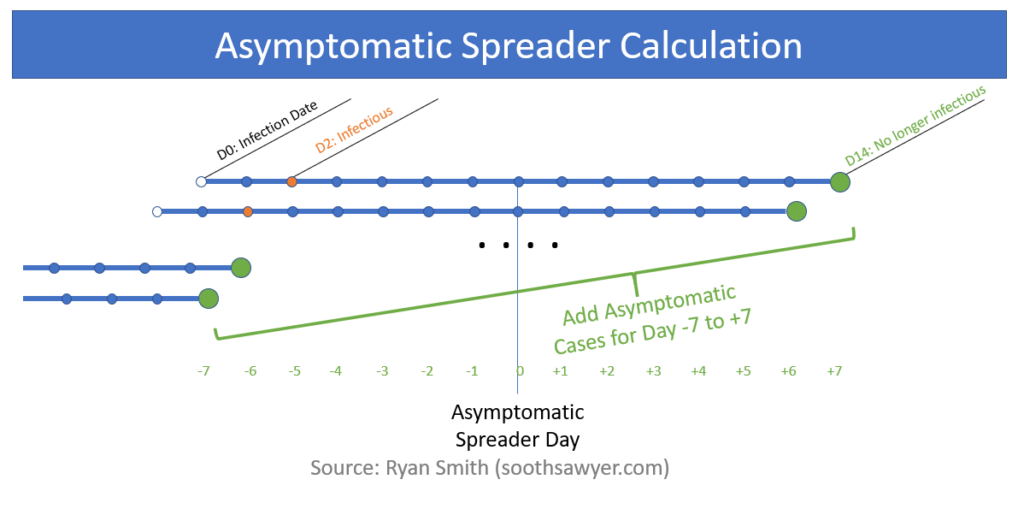
To understand how I calculate “Asymptomatic Cases” since this is not in any John Hopkins (or other) data please go to the “Calculations” section below.
Adding these two (symptomatic and asymptomatic spreaders) we can see how many total spreaders there are on any given date. With that, we can calculate your chances of being around someone with COVID-19.
And since we have this data down to the county level in the US, I can provide you with your specific county info so you can know how much risk you are or are not taking. Cool.
More details on my assumptions
In short, my assumptions (based on analyzing many scientifically approached antibody studies and comparing to confirmed cases and deaths) are that the normal CFR is 3.6%, IFR (Infection Fatality Rate) is 0.8%, and asymptomatic (possibly mildly symptomatic) is at 78%. Of course CFR and IFR could be higher in certain regions, especially if the ability to care for patients goes down.. For example, if you run out of ventilators/ICU beds. I do not take that into account and instead opt to assume a standard CFR/IFR. My assumption will only over-estimate the number of spreaders; see the section below on “disagreement” to understand the impact of you having another assumption.
To calculate the spreaders, you need to know the following:
- Actual Confirmed Cases (confirmed cases, but adjusted for under-testing)
- *Real* CFR (Case Fatality Rate) to estimate under-testing %
- % of symptomatic vs asymptomatic cases
- Antibody test results (only looking at ones where a scientific approach was used.. not like the Santa Clara, CA antibody test) to estimate where CFR should fall and help see what percent of people were tested (implying low or no symptoms)
- Estimate of how long someone is infectious for
- Incubation period of COVID-19
Calculations Used for Calculating Spreaders
- CFR = Cumulative Deaths / Cumulative Cases
- Estimated Percent of Infected Tested = 3.6% / min( CFR, 100%)
- This assumes that 3.6% is the normal CFR
- If it’s lower, it effectively uses the lower CFR number
- If it’s higher, the assumption is this area was under-testing
- Symptomatic Cases = Cumulative Cases / Estimated Percent of Infected Tested
- Estimated Infected = Symptomatic Cases / (1-0.78)
- Asymptomatic Cases = Estimated Infected – Symptomatic Cases
- % Infected = Estimated Infected / Population
- IFR = Cumulative Deaths / Estimated Infected
Do you disagree with my assumptions?
Do you disagree with some of my assumptions? Like a really high 78% asymptomatic figure.. or a lower CFR of 3.6%.. or the amount of time people are contagious? Great! Then you are in luck and the number of spreaders out there will only be lower than everything I show you. So my estimates for spreaders are on the high end and your risks of being around someone with COVID-19 are only lower. Lucky you.
Do you want to see some real COVID-19 data showing spreaders?
Learn how many people are contagious in your county (map view):
https://www.soothsawyer.com/covid-19-how-many-people-are-contagious-right-now-in-your-county/
Top COVID-19 spreaders, by country:
https://public.tableau.com/profile/rks125#!/vizhome/Covid-19Ryan/SpreadersbyCountry10Kdeaths
Dashboard for County-Level statistics, including spreaders:
https://public.tableau.com/profile/rks125#!/vizhome/Covid-19Ryan/Dashboard-Multi-Countyv3

I have been around IT since I was in high school (running a customized BBS, and hacking) and am not the typical person that finds one area of interest at work; I have designed databases, automated IT processes, written code at the driver level and all the way up to the GUI level, ran an international software engineering team, started an e-commerce business that generated over $1M, ran a $5B product marketing team for one of the largest semiconductor players in the world, traveled as a sales engineer for the largest storage OEM in the world, researched and developed strategy for one of the top 5 enterprise storage providers, and traveled around the world helping various companies make investment decisions in startups. I also am extremely passionate about uncovering insights from any data set. I just like to have fun by making a notable difference, influencing others, and to work with smart people.