
If you have been wondering what the infection rates for COVID-19 are in your state or county is, you found the one place on the internet that will cover just that. After analyzing numerous antibody studies, filtering out the non-scientifically approached ones, and correlating that with (1) other studies that looked at asymptomatic infections and (2) viral test results that everyone is getting daily news feeds on, I have come up with infection rates for anywhere in the world. For this post, we will focus on the U.S. even though I have data for the entire world.
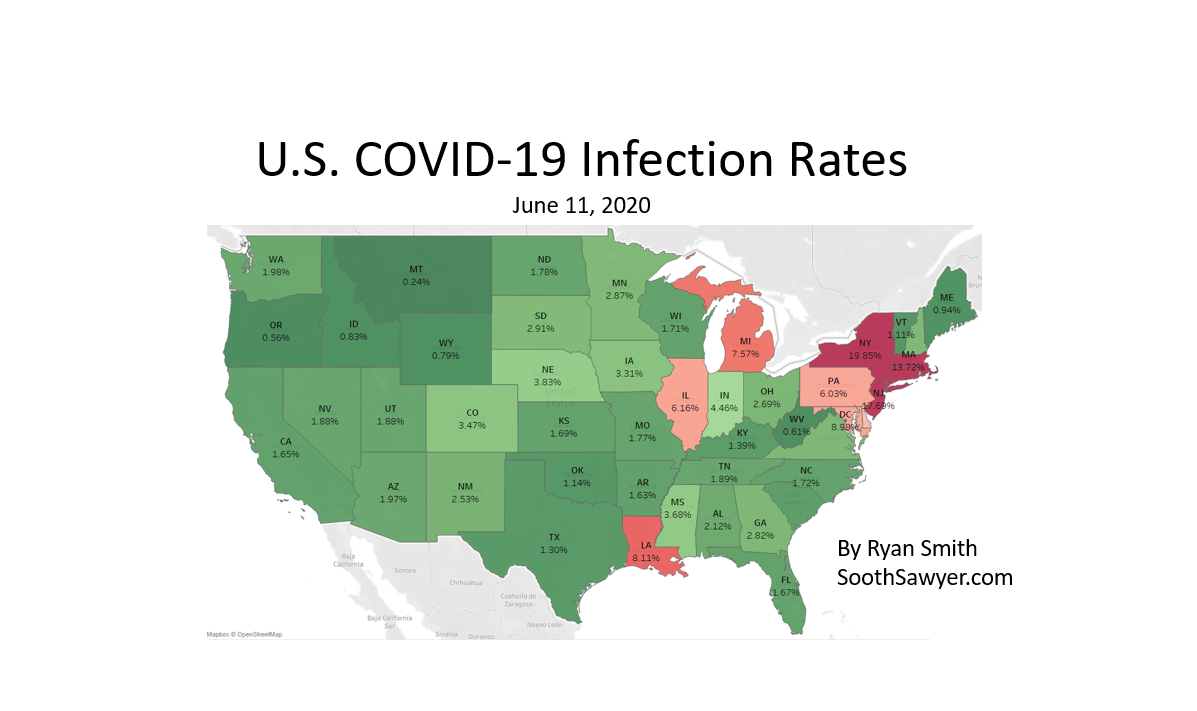
U.S. COVID-19 Infection Rates
If you are on a mobile device, this may be hard to view (because Tableau hasn’t quite figured out mobile) so you can click here to see a screen shot of this map taken on June 11, 2020.
You can view this COVID-19 infection rate map on my Tableau account, along with over 75 other visualizations by clicking here.
Note that I calculated the infection rate with this fomula:
[Infection Rate] = ([Cumulative Confirmed Cases]/(min(0.036/([Cumulative Deaths]/[Cumulative Confirmed Cases]),1))/(1-0.78))/[2019 Population]
In “plain English”, this is basically adjusting the Confirmed Cases based on an assumption that the CFR (Case Fatality Rate) is 3.6% (or lower). I have come up with this assumption based on numerous comparisons of antibody, viral test results, and COVID-19 studies. This also results in an IFR (Infection Fatality Rate) of 0.8%. I have settled on these figures for over a month now and have found any new studies to only confirm my assumptions. Obviously, if an area is stressing their hospital resources, these figures would increase, and I *do not* account for these anomalies. Worth explaining is that I will not adjust the confirmed cases if the CFR is lower than 3.6% (even though I believe this implies other problems in the reporting); In other words, if the CFR is lower than 3.6%, I use that figure (so the recent decline of CFR will automatically be handled by this model). After that, we add in asymptomatic patients which I have concluded to be 78%; this is based on numerous studies that I discuss here. Then, simply divide that figure by the total population and we end up with an infection rate. Easy, right? 🙂
As I outline in the link in the previous paragraph, if you disagree with any of my assumptions then any infection rate I outline will only be lower. In other words, my infection rates are aggressively on the HIGH side. In other other words, these are MAX figures. But at the same time, I must stress that based on antibody studies, my figures only support their conclusions. Furthermore, at this point I believe my estimates are the most accurate representations of infection rates for COVID-19 that are publicly available; Wow, such a bold claim.
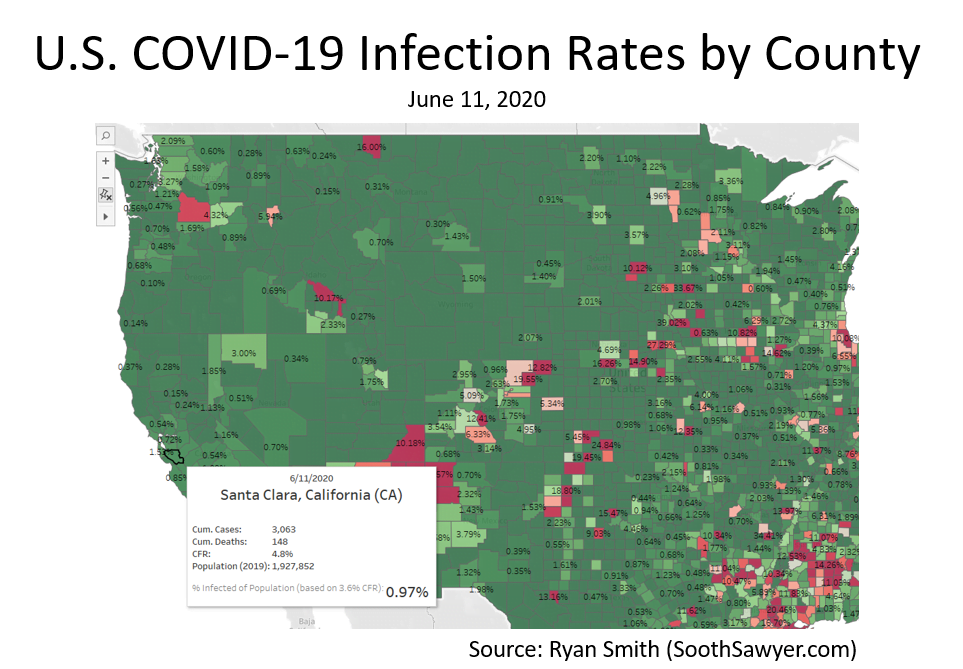
COVID-19 County Infection Rates
If you are having difficulty viewing the Tableau visualization on your mobile, click here to view an image of the above infection rate map (from June 11, 2020)
I live in Santa Clara and we are currently (on June 11, 2020) at around 1% infection rate. We have a LONG way to go. Where is your county at?
California COVID-19: A Closer Look
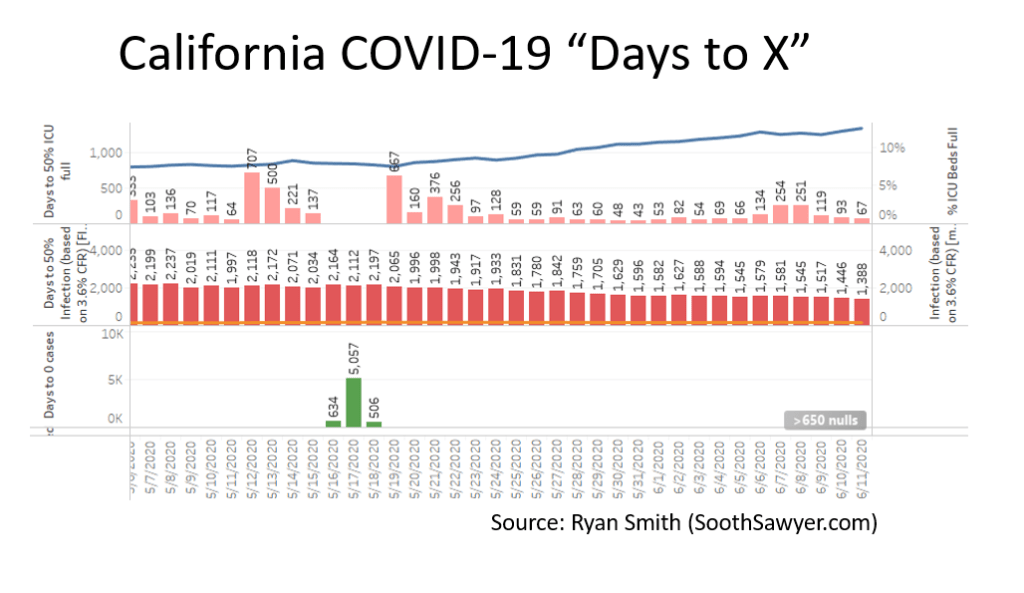
Click here to enlarge the above image
The above chart drills into California, my home state. By using logarithmic calculations (to solve for the “days” in the CAGR (more specifically CDGR) formula, as well as basic slope calculations, we are able to come up with the number of days it will take to reach certain milestones.
As you can see, California is not even approaching zero cases so we aren’t heading in that direction. I guess I could have assumed zero cases once we reach 100% infection rate; if I get time I’ll adjust my formula. Until then, lets look at how long it will take to get herd immunity in California since that is the more likely outcome. The definition of herd immunity differs depending on your assumptions. I believe most have settled on around 60% but I like to be conservative in my estimates that way they are harder to argue (the internet is way too critical these days). Based on my calculation, by maintaining our same new daily cases (basic slope calculation), we are looking at California hitting 50% infections for COVID-19 by in 3.8 years (1,388 days). Wow.. good luck with that. Let me explain my sarcastic comment: The only way we are hitting herd immunity is with a vaccine. Either that, or more pool parties and concerts! So, get out there and join the herd!
A little bonus in the screen shot I provided, you can see CA will hit 50% ICU usage within two months if we keep up our shenanigans (current growth rate). This would ultimately imply higher CFR rates because of the resulting stressed medical care. Sad day.
Have other questions about COVID-19?
Just ask. I have a data set that I have built up over the past few months that includes political affiliation, population density, % of population that takes public transit, age of population, ICU beds by county, quarantine dates, and more. You can download this Ultimate COVID-19 data set to answer all the questions you ever had about COVID.
I have numerous universities, countries, and private companies leveraging this data set. You should too. 😉
Or you can leverage the over 75 visualizations I have done on Tableau that does additional calculations that does logarithmic, slope, and CAGR calculations to give you “Days to X” (X being 50% ICU bed usage, zero cases, 50% infection rate, etc).
Finally, thank you for being forever curious. Without people like you we would never evolve, innovate, and solve difficult problems.

I have been around IT since I was in high school (running a customized BBS, and hacking) and am not the typical person that finds one area of interest at work; I have designed databases, automated IT processes, written code at the driver level and all the way up to the GUI level, ran an international software engineering team, started an e-commerce business that generated over $1M, ran a $5B product marketing team for one of the largest semiconductor players in the world, traveled as a sales engineer for the largest storage OEM in the world, researched and developed strategy for one of the top 5 enterprise storage providers, and traveled around the world helping various companies make investment decisions in startups. I also am extremely passionate about uncovering insights from any data set. I just like to have fun by making a notable difference, influencing others, and to work with smart people.