I came across enough hints from VAST Data thru their momentum posts, that I was able to determine their actual revenue to date along with an estimated NAND Flash TAM. In addition, using LinkedIn, I was able to breakdown their sales force to see what the team looks like.
Why did I do this? I recently got Covid and was isolated from my family in the evenings. I saw a pretty easy mental puzzle cross my way to pass the time in ‘prison’ and thought I’d share the results; I can’t resist a good yet easy-to-solve puzzle. 😉
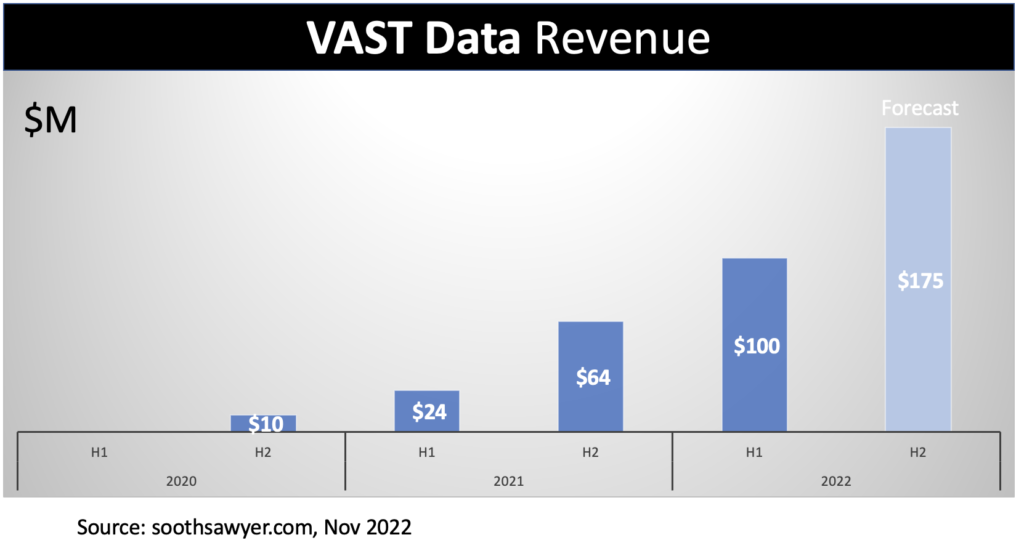
Revenue for VAST Data
VAST Data Revenue
For the actual halves that have completed (up to 1H2022), VAST Data has managed to generate about $200M in revenue thus far and they are on track to add another $175M for 2H2022 (based on estimated booking rates); so by the end of 2022, VAST will have pulled in a total of $375M in it’s lifetime. This is a great achievement.
Please see the “How I” section below to see how I was able to figure out VAST Data’s revenue figures. For 2022H2 (not yet complete), I estimated based on a previously communicated bookings annual rate of $300M or so, which would have put the half at $150M, but the $300M rate was provided in the Feb 2022 timeframe, so I upped the rate a little, providing the $175M figure for 2022H2.
The latest valuation I could find on VAST Data was $3.7B, which would put their EV / 2022 Revenue at 13.5x; I did not account for debt or cash equivalents due to a lack of available information.
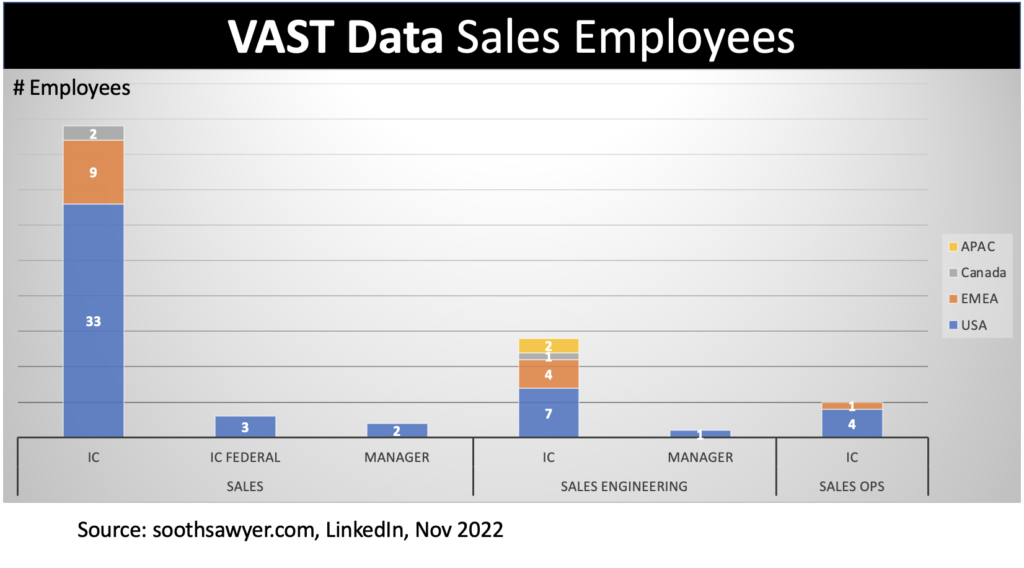
VAST Data Sales Employee Demographics
VAST Data Sales Employee Demographics
As of November 2022, VAST Data has roughly 47 individual contributors (IC) in its sales force, according to LinkedIn. With an estimated $275M in revenue for 2022, that would be $5.9M in annual revenue per sales rep, which is a pretty respectable figure. When I previously analyzed Pure Storage, the average revenue per rep was closer to the $1.2M range. Although to be fair, with Pure Storage, I used general Sales employee counts and the equivalent for VAST would be around 100 (out of their 450+ employees), putting their apples-to-apples average at $2.75M/sales employee, which is still great.
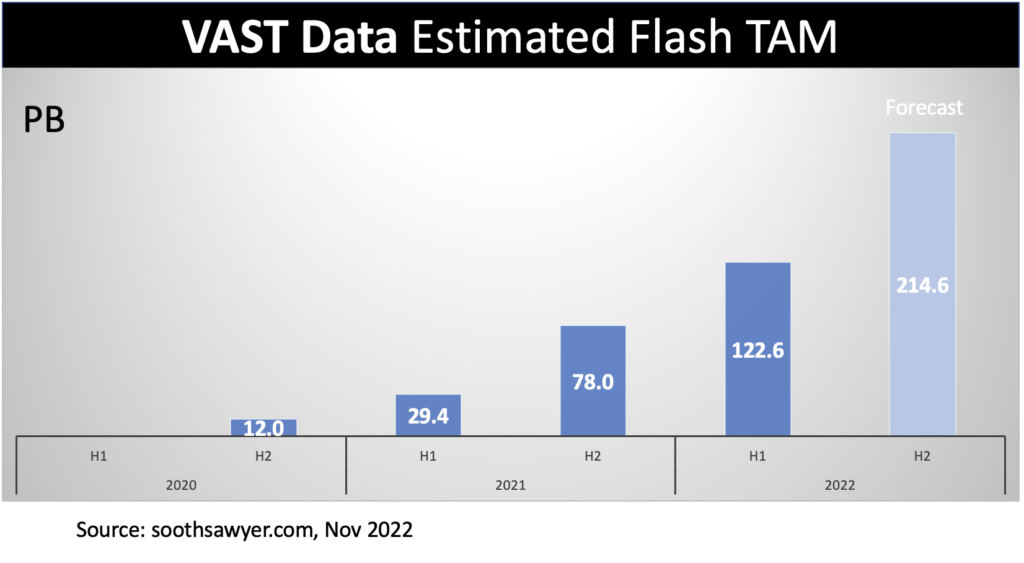
Estimated NAND Flash TAM at VAST Data
VAST Data NAND Flash TAM
I estimate that the VAST Data Flash TAM for 2022 is over 300PB! You can see more about how I calculated the estimated Flash TAM below if you want more details.
We have experienced significant growth, with revenue increasing from $6.1 million for the fiscal year ended January 31, 2013 to $42.7 million for the fiscal year ended January 31, 2014 and to $174.5 million for the fiscal year ended January 31, 2015, representing year-over-year revenue growth of 603% and 308% for our two most recent fiscal years. Our revenue increased from $24.6 million for the three months ended April 30, 2014 to $74.1 million for the three months ended April 30, 2015, representing period-over-period growth of 201% for our most recent interim period. Our net loss was $23.4 million, $78.6 million, $183.2 million, $30.0 million and $49.1 million for the fiscal years ended January 31, 2013, 2014 and 2015, and the three months ended April 30, 2014 and 2015, respectively.
We have significantly expanded our overall business, customer base, headcount, channel partner relationships and operations in recent periods, and we anticipate that we will continue to expand and may experience rapid growth in future periods. For example, from January 31, 2014 to January 31, 2015, our headcount increased from over 350 to over 800 employees, and to over 1,100 employees as of July 31, 2015.
The first two revenue years would be 2013 and 2014, which was $6.1M and $42.7M, for a total of $48.8M in revenue for Pure Storage. Additionally, we can see the reference to Jan 31, 2014 having a headcount of 350 which matches what VAST indicated for end of year 2 headcount for Pure, confirming that the Jan 31, 2014 is the end of year 2.
Additionally, the first full year revenue for Pure was $42.7M in 2014.
We have experienced significant growth in recent periods, with total revenue of $30.5 million, $127.1 million and $241.4 million for fiscal 2013, fiscal 2014 and fiscal 2015, respectively, representing year-over-year growth of 316% and 90%, respectively. For the three months ended October 31, 2014 and 2015, our total revenue was $46.1 million and $87.8 million, respectively, representing year-over-year growth of 91%. We have continued to make significant investments as we scale our business, including in developing and improving our platform, expanding our sales and marketing capabilities and global coverage, and in expanding our general and administrative resources to support our growth. As a result, we had net losses of $44.7 million, $84.0 million and $126.1 million for fiscal 2013, fiscal 2014 and fiscal 2015, respectively, and $28.5 million and $38.5 million for the three months ended October 31, 2014 and 2015, respectively. Net cash used in operating activities was $29.1 million, $45.7 million and $25.7 million for fiscal 2013, fiscal 2014 and fiscal 2015, respectively, and $6.9 million and $5.6 million for the three months ended October 31, 2014 and 2015, respectively. As of October 31, 2015, we had an accumulated deficit of $312.0 million.
Our employee headcount increased from 247 as of July 31, 2013 to 1,368 as of October 31, 2015, and we expect to have significant headcount increases in the future.
Diverse and global business: Our platform addresses a common set of critical IT issues which are pervasive across a diverse array of workloads, range of industries and customer segments. Since selling our first product in fiscal 2012, we have taken advantage of this large opportunity, and now have customers spanning more than 75 countries, with international revenue comprising 33% of total revenue for fiscal 2015.
The first full year revenue for Nutanix was 2013 since they noted they started selling its first product in fiscal 2012.
So for the first two years of revenue for Nutanix, we want 2012 and 2013 revenue. According to their ‘Consolidated Statements of Operations Data’, 2012 had $6.59M in revenue. That makes the first two years of revenue at $30.5M + $6.6M = $37.1M.
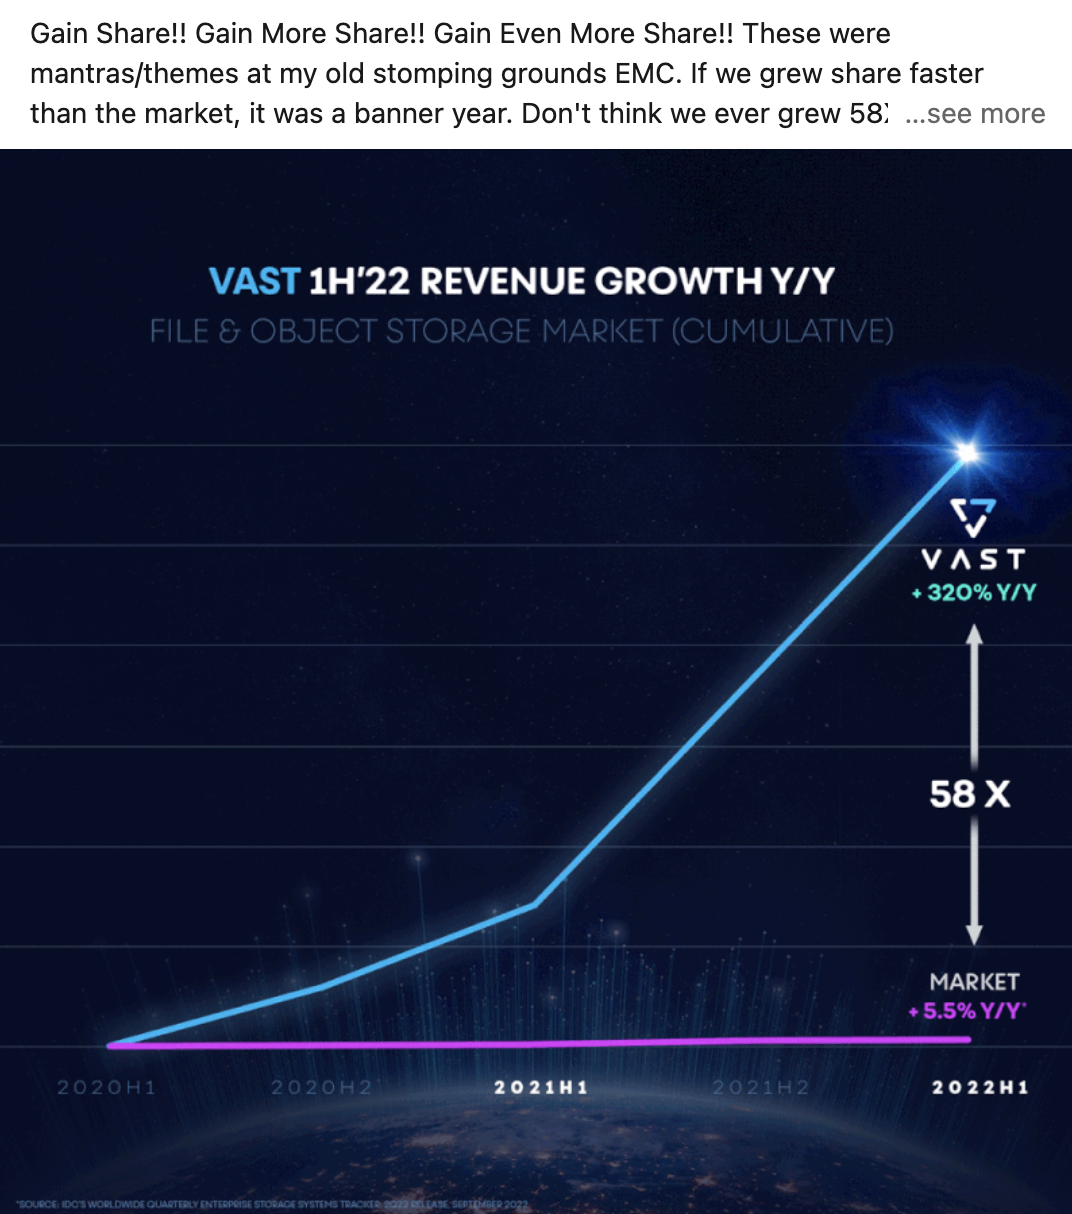
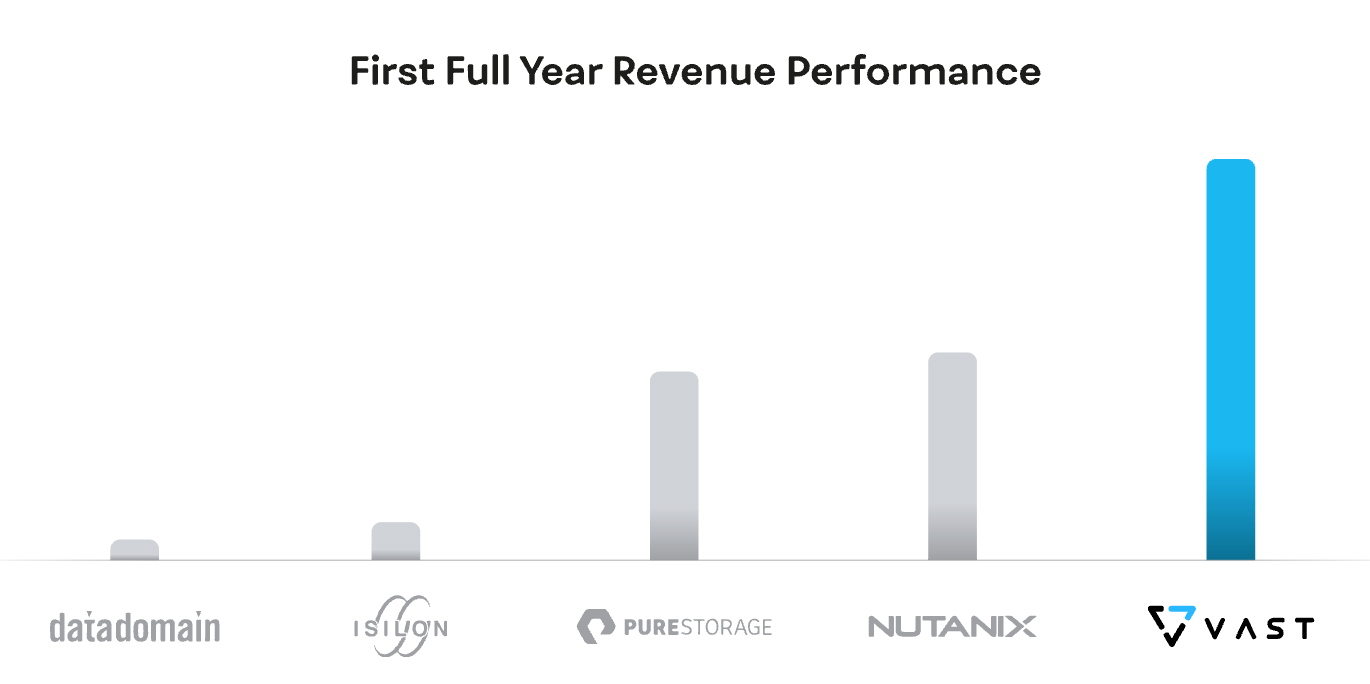
Measuring the delta in pixels from Pure Storage to VAST, and applying that multiple, we take Pure’s $42.7M and multiply it by 2.11 and compute the first year revenue for VAST to be $90.22M. The Nutanix bar thru me off because the first full year of revenue was actually $30.5M (less than Pure Storage). However, based on the pixel differences it looks like VAST thought the Nutanix figure was $46.1M which matches a quarterly revenue number ending in October 2014. I assume that the person creating the chart made a simple mistake of jotting down the wrong number.
LinkedIn Post by VAST:
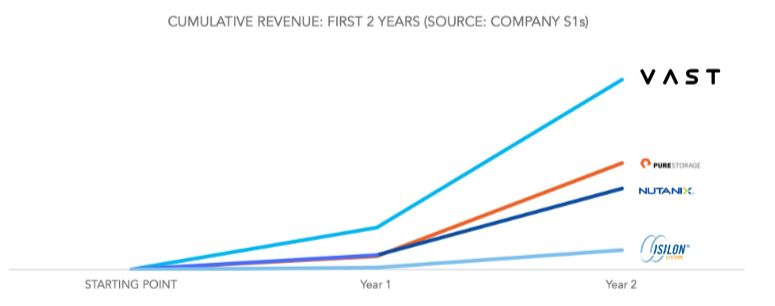
In fact, let’s look at another post by VAST that contradicts the “first full year” revenue for Nutanix being lower than Pure.:
In a recent post by VAST, they provided some nice data points that help fill in the picture. Remember, we noted that the first full year revenue is $90.22M so we know that 2021H1 + 2021H2 = $90.22M. Additionally we know that 2022H1 is 320% higher than 2021H1. And we know 2020H1 = $0 in revenue. From earlier, we also know that 2021H1 + 2020H2 + 2021H1 + 2021H2 = ~$100M. If all of 2020/21 is $100M and 2021 is $90.22M then 2020H2 must be around $9.78M.
Simply by looking at the pixel differences in the lines, we can extrapolate out:
2020H1 = $0
2020H2 = $9.78M
2021H1 = $24M
2021H2 = $63.6M
2022H1 = $100M
Just do some quick checks, $24M to $100M is 316% YoY growth which is close to the 320% YoY growth mentioned by VAST for 2021H1 to 2022H1. Additionally, for the first two years, revenue would be $0M + $9.78M + $24M + $63.6M = $97.38M which is just about the $100M mentioned by VAST as their first two year revenue number. If I add up the ‘first full year revenue’ that would be 2021 at $24M + $63.6M = $87.6 which is close to the estimate we had of $90.22M. I actually do think 2021 was closer to the $87.6M but I’m not going to spend much time improving the accuracy between $87.6M and $90.22M. 🙂
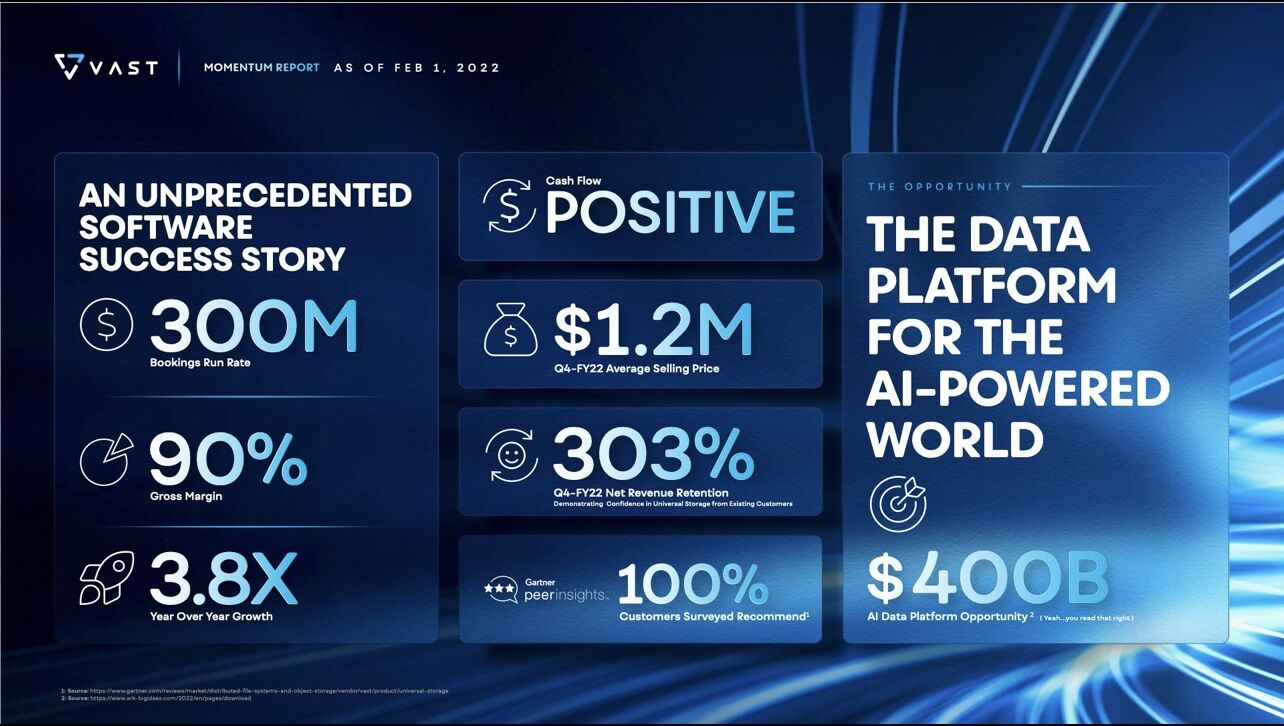
I wasn’t planning on analyzing this part, but this LinkedIn post gives us a gross margin of 90% which lets us have an idea of the COGs for VAST. Since VAST consists mostly of Flash, and Flash is expensive, I would take a guess that 90% of their COGs is for Flash.
Taking the revenue numbers, and backing out margin, and then taking 90% of that number (assumes 10% are costs for other things like enclosures and faster than Flash technology), we get estimated Flash spend per half year.
Flash spend by VAST:
2020H1 = $0
2020H2 = $9.78M * (1-0.9) * 0.9 = $0.88M
2021H1 = $24M * (1-0.9) * 0.9 = $2.16M
2021H2 = $63.6M * (1-0.9) * 0.9 = $5.72M
2022H1 = $100M * (1-0.9) * 0.9 = $9M
And using my handy dandy SSD Cost calculator, since VAST uses QLC, let’s use a conservative $0.07/GB that they are paying for Flash. If they are spending more $/GB, then their Flash TAM is smaller.
I have been around IT since I was in high school (running a customized BBS, and hacking) and am not the typical person that finds one area of interest at work; I have designed databases, automated IT processes, written code at the driver level and all the way up to the GUI level, ran an international software engineering team, started an e-commerce business that generated over $1M, ran a $5B product marketing team for one of the largest semiconductor players in the world, traveled as a sales engineer for the largest storage OEM in the world, researched and developed strategy for one of the top 5 enterprise storage providers, and traveled around the world helping various companies make investment decisions in startups. I also am extremely passionate about uncovering insights from any data set. I just like to have fun by making a notable difference, influencing others, and to work with smart people.
I have been around IT since I was in high school (running a customized BBS, and hacking) and am not the typical person that finds one area of interest at work; I have designed databases, automated IT processes, written code at the driver level and all the way up to the GUI level, ran an international software engineering team, started an e-commerce business that generated over $1M, ran a $5B product marketing team for one of the largest semiconductor players in the world, traveled as a sales engineer for the largest storage OEM in the world, researched and developed strategy for one of the top 5 enterprise storage providers, and traveled around the world helping various companies make investment decisions in startups. I also am extremely passionate about uncovering insights from any data set. I just like to have fun by making a notable difference, influencing others, and to work with smart people.


