
What you will learn in this article
After reading this article, you will learn:
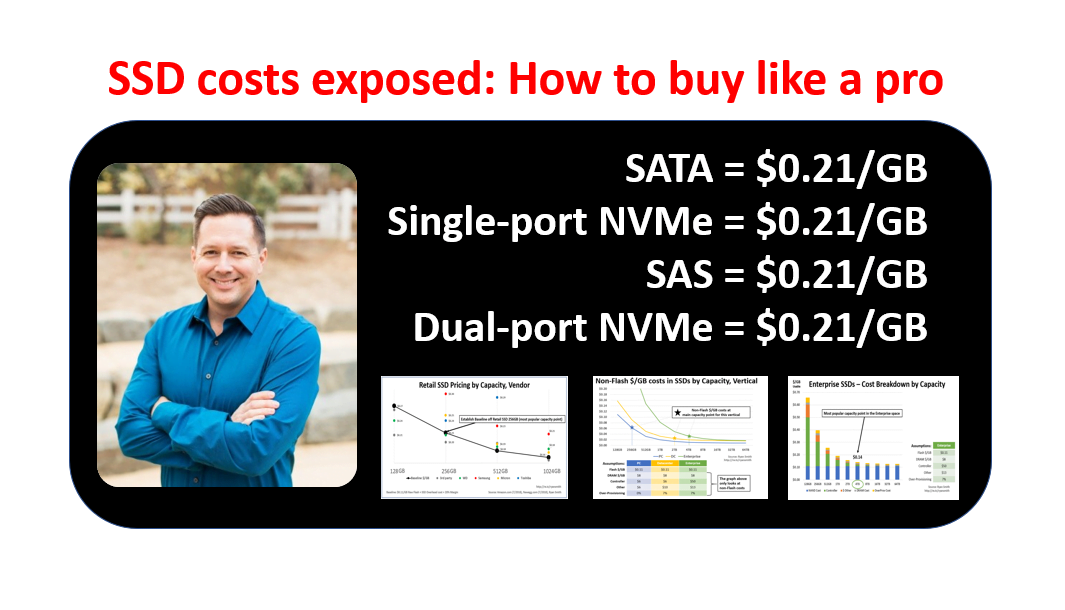
- All SSDs in all verticals (e.g., PC, Retail, Datacenter, Enterprise) should be priced the same ($/GB); The key to understanding this is looking at non-NAND related costs over different capacity points, while considering the current average capacity point in each vertical. Based on today’s pricing in the retail space, all SSDs in all verticals should be priced around $0.21/GB.
- Why NAND Suppliers would prefer to sell to Datacenter customers, assuming pricing is equal between all verticals. Assuming prices were the same for all types of SSDs, it is actually more profitable for a NAND supplier to sell Datacenter (single-port NVMe and SATA) and Enterprise SSDs (dual-port NVMe and SAS) than it is to sell PC/Retail SSDs at the average capacity points today!
- How you can use retail SSD pricing to help guide you in pricing all types of OEM SSDs in any vertical (e.g., PC, Datacenter, Enterprise Storage)
- The size of all SSD verticals are large enough to no longer be considered a niche; in other words, academically you should be able to command the same price no matter what SSD you buy (e.g, SATA, NVMe, Dual-port NVMe, SAS); especially if you are a “Billionaire” (click here to read an article I wrote referencing “Billionaires”).
Why I wrote this article
I was compelled to analyze and share insights around SSDs costs because SSDs, especially OEM-based SSDs, are significantly over-priced today relative to the associated costs. I believe part of this is because NAND suppliers are still taking advantage of the price flattening (which is technically increasing prices) and/or explicit increases that happened during the Flash shortage of 2016/17 and trickling out price decreases slower than they should be since the recovery began in Q3’17. Additionally, NAND suppliers are leveraging yesterday’s mainstream capacity point cost structures to dictate today’s pricing on higher density SSDs; Yet most customers haven’t challenged this “old school” thinking.
Of course, I understand that market dynamics also play a role in pricing but it makes no sense that Enterprise SSDs should be at a similar gross margin structure as an enterprise storage array, for example. The amount of company resources needed to market/sell a storage array is much, much higher and complicated than getting SSDs qualified (I am not saying it’s easy to make an SSD but trying to compare it to the relative complexity of moving up the value stack). Right now, I estimate that Enterprise SSDs are upwards of 60%+ gross margin which is comparable to what storage array vendors make. The amount of value being captured by NAND suppliers in this market is way out of whack.
Enough small talk.. Let’s get started!
It is really the non-NAND related costs that dictate cost differences between verticals and different capacity points within a vertical. And this is how we will now breakdown the true costs of SSDs.
Let’s first look at the average capacity points today to set the context on the rest of the article.
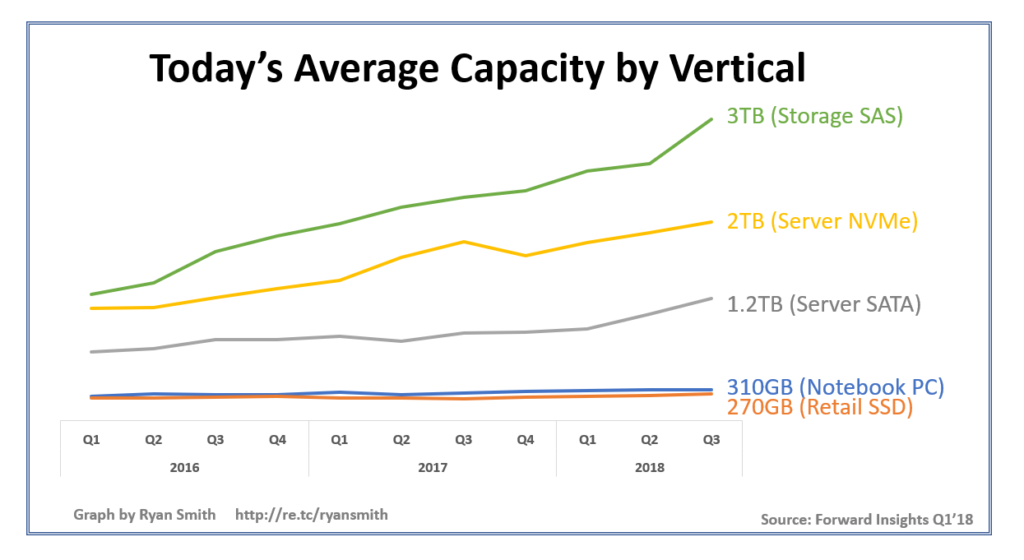
As you can see, the SSD vertical highly dictates the average capacity point that an SSD sells at. It turns out that capacity points are an extremely important data point to consider on pricing/costs of an SSD, especially in capacity points less than 1TB. From a NAND supplier’s perspective, their overall average cost structure selling into a particular vertical will be dictated by these average capacity points. Please keep note of each of these averages, as we will use this in subsequent analyses.
Retail SSD Cost Structure
Of all the verticals, let’s first look at PC and Retail SSDs. I start with this vertical because pricing is generally the lowest and publicly available, and its pricing will prove to be a great benchmark used on pricing the other verticals.
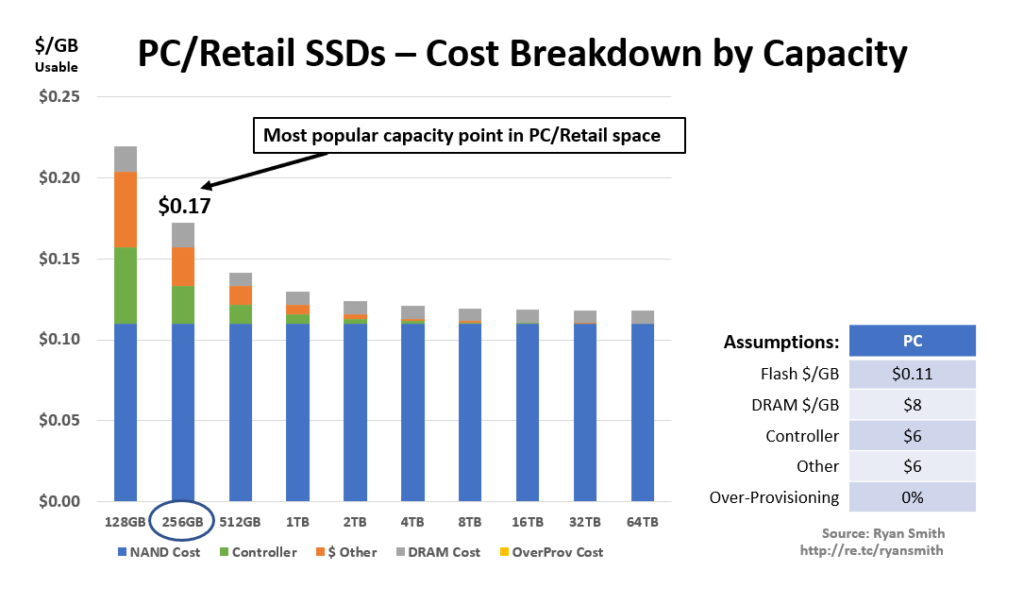
As you can see, I am showing all the costs that go into SSDs. Obviously, at a per GB level, the cost of NAND is static across all capacity points. What you see differ between capacity points are non-NAND costs such as the SSD controller, other (e.g., PCB, packaging, connectors), etc. And this makes sense since you can lower the fixed non-NAND costs, per GB, if you spread it out over more NAND. You can clearly see the assumptions I made on costs to the right of the graph to understand how the costs were calculated at each capacity point.
I highlighted the main selling capacity point (refer back to the average capacity graph shown earlier, if needed) for PC/retail drives at 256GB. Looking at this particular density, it shows you that the average cost structure to a NAND supplier is around $0.17/GB for PC/retail if they are selling in this segment. This is of course assuming NAND costs of $0.11/GB (see my previous NAND cost analysis by NAND supplier by clicking here). I believe the cost of NAND is lower for suppliers, but we will go with this as a conservative estimate. Furthermore, you can see that the overall cost savings by moving to higher density PC/retail SSDs diminishes after 1TB. However, does it even matter since the PC/Retail space is mainly going to sell 256/512GB for a long time to come.
Key takeaway: It is critical to understand the costs at the capacity point your organization is at. This makes a big difference in the cost structure of the SSD. And it’s critical to understand the average cost to the NAND supplier to compare against your vertical and average capacity point; this is very powerful information to understand in negotiations.
Datacenter SSD Cost Structure
Next, let’s look at the same type of cost analysis for Datacenter SSDs (both single port NVMe and SATA).
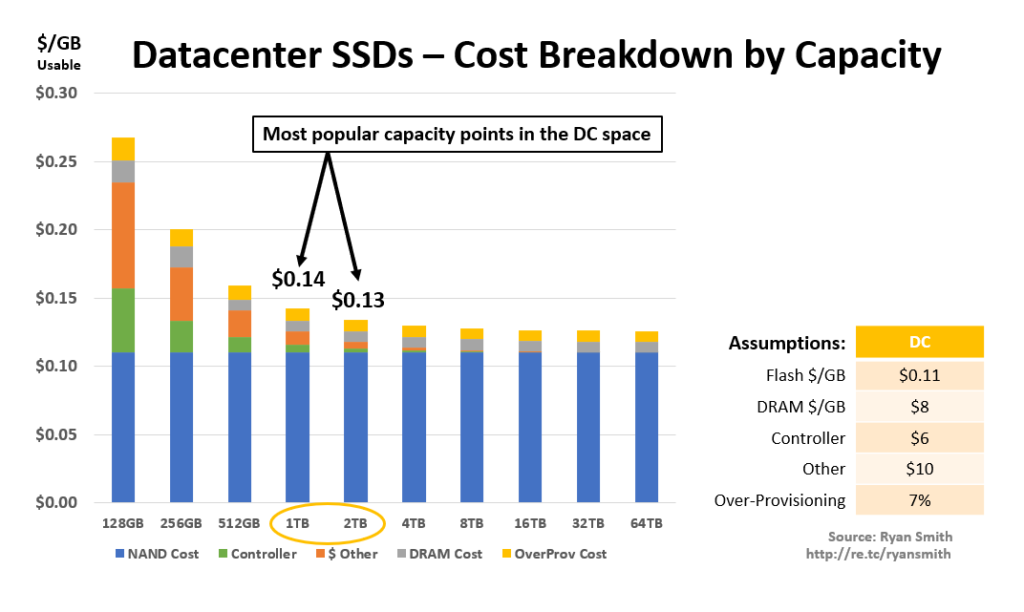
Again, I highlighted the main density points of 2TB (NVMe) and 1TB (SATA). You can see that the overall cost structure is between $0.13 and $0.14/GB, respectively, using the assumptions I outlined to the right of the graph. One thing to note is that this type of SSD typically has 7% over-provisioning which adds another cost to the usable $/GB but that’s all included in this cost breakdown. Notice that the cost savings by moving to higher density points is not really worth it past 2TB and I would expect this to impact the buying behavior of Hyperscale-type customers. This may be why you see some hyperscalers moving to M.2-like form factors (often cramming multiple of these into a single drive sled) to achieve higher effective density points since other things are critical to these customers like IOPS/GB, especially after there are no real cost benefits by moving to higher capacities.
Enterprise SSD Cost Structure
Let’s now take a look at Enterprise SSDs. This would include high performance, high powered SAS and dual-port NVMe offerings you see today. These are the “premium” offerings by SSD makers.
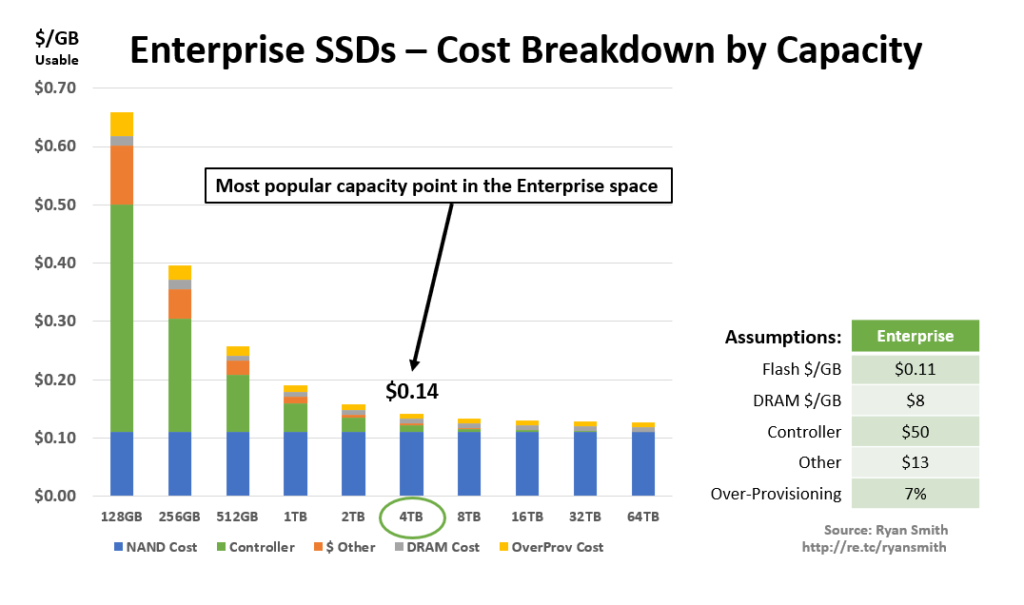
Wow, take a look at this. As you can see, at the average capacity point of 4TB in this space, the cost structure is only $0.14/GB. This is less than the PC cost structure and similar to that of the DC cost structure. Then why are SSD makers charging a premium on these type of drives? Also, take a look at how there really is no further cost benefits by moving beyond 4TB to 8TB.
Comparison between all SSD Verticals
Let’s compare all the verticals in one graph to make it easier to look at.
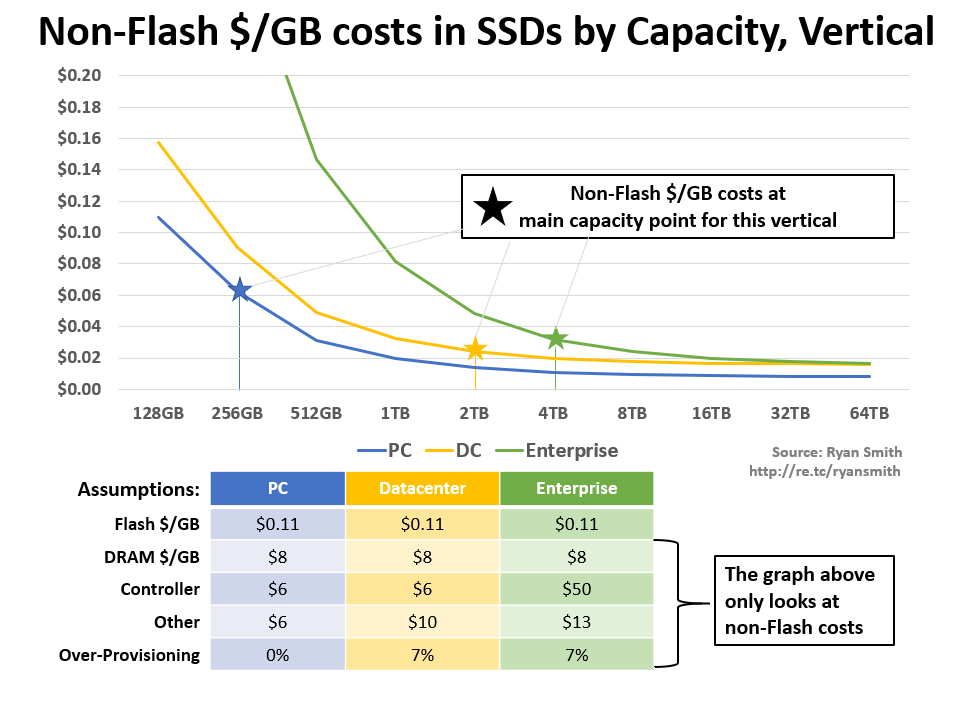
What we are looking at here is taking just the non-NAND related costs from all the previous graphs shown earlier. This makes it easier to see the difference between all verticals by removing the fixed $0.11/GB NAND costs that is the same, regardless of vertical and capacity point.
Additionally, I highlighted the main capacity points in each vertical just like I did on each of the individual previous cost breakouts.
What you quickly see from this line chart is that the average cost structure for selling DC and Enterprise-based SSDs is lower than PC/retail SSDs. You also see that 2TB DC SSDs are the best average capacity cost structure out of all verticals. Assuming all SSDs in all verticals were priced identically, NAND suppliers would make more money by selling the 2TB DC SSD over the other two verticals.
Let’s look at this slightly different. Instead of looking at what the average capacity points are in each vertical, let’s establish a baseline cost point off of the 256GB PC/Retail SSD so we can see what density points you would have to be at in the DC and Enterprise verticals in order to have the same or lower cost structure than the main seller in the retail space.
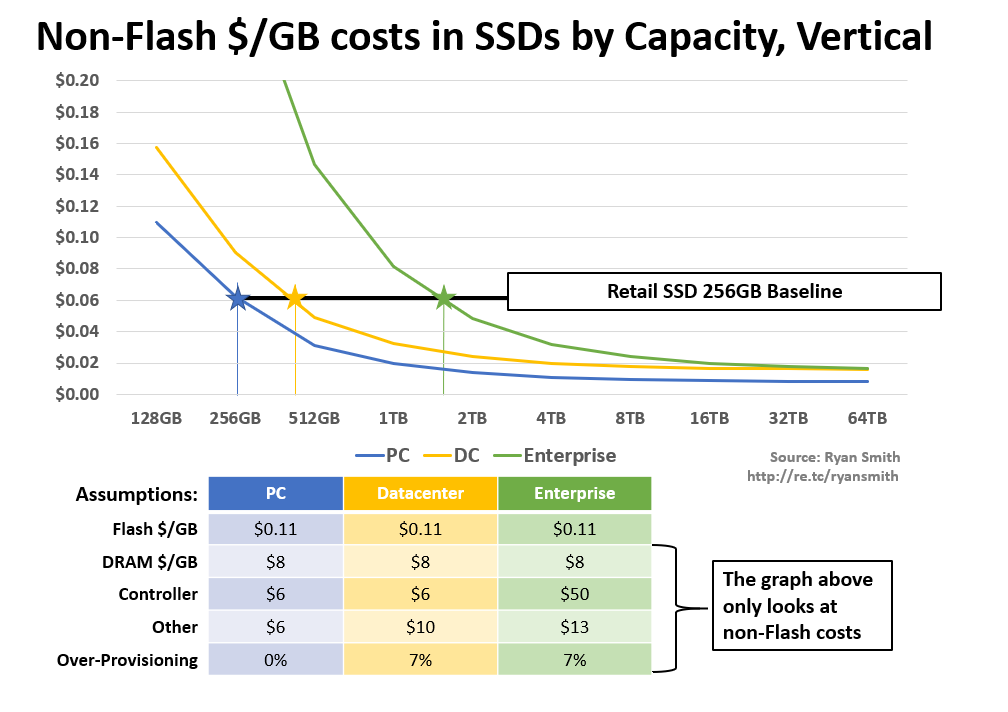
As you can see, if you are buying at least a 512GB (raw) DC SSD or a 2TB (raw) Enterprise SSD, you should have a lower cost structure than the the main seller in the retail SSD space. Why are SSDs priced higher in DC and Enterprise? Because the average OEM customer hasn’t realized this critical way of looking at costs. Once this is realized, OEMs will be better armed to negotiate pricing to where it should be.
Why did I choose to compare the Datacenter and Enterprise vertical to 256GB PC/Retail SSD capacity point? Because this is the average cost structure in that vertical and pricing is publicly available. This lets me know an acceptable margin structure by that supplier. I can use other capacity points as well to help understand the supplier’s true bottom price as well.
Retail SSD pricing to the rescue
Retail SSDs are important because pricing is publicly available and easy to track. Because of this, I easily scraped the current $/GB pricing off of Amazon.com and Newegg.com for all the major NAND suppliers and some 3rd party SSD makers and slapped it into the below chart.
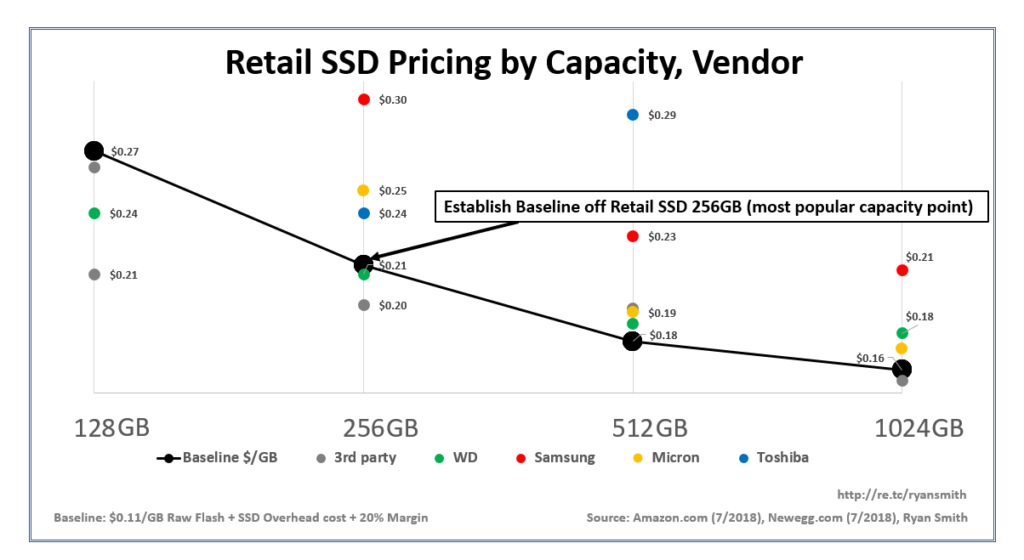
Additionally, I added a “Baseline $/GB” line to overlay our previously outlined SSD cost structures for PC/Retail drives against real Retail SSD pricing seen in the market. I chose to make the baseline price point map to WD’s price of $0.21/GB on the 256GB capacity point by assuming a gross margin 20%. All the cost structures built into this baseline are identical to what I covered earlier in the article with the PC/Retail SSD cost structure graph, with the addition of gross margin. I chose 256GB because that is the main runner in the retail space so I thought this would be a good place to establish a baseline.
Sticking with WD, if my cost assumptions and 20% margin are true, the baseline $/GB maps out nicely to the 512GB/1TB capacity points price; In fact, it actually looks like WD is making slightly higher margin on those higher capacity points.
An obvious outlier on pricing at 256GB is the highest red dot, at $0.30/GB. This may indicate that this vendor has higher pricing in other verticals that they can leverage from their customer base; Therefore to make it attractive enough to sell a 256GB retail drive, they would need this price. But notice the higher capacity points are less of an outlier; based on the PC/retail cost structure analysis we did, there are likely different gross margins at play between the capacity points, seemingly to discourage the sales at lower capacity points. Please remember to consider that the cost structure will be more attractive to a supplier as the capacity increases and therefore allow them to go much lower in pricing, relative to the average capacity of 256GB.
Assertion: Pricing of all SSDs should be the same
Based on the average cost structures outlined in this article, there is no reason for the pricing to differ between any of the verticals, assuming you are buying a 480GB+ Datacenter SATA/NVMe SSD or a 2TB+ Enterprise SAS/NVMe SSD.
Why is there such a huge difference then between retail pricing of SSDs (at $0.21/GB) and DC and Enterprise SSDs? It’s not the underlying costs to the NAND supplier, as we have seen outlined in this article.
You could assume that the Retail SSD market is bigger than the DC and Enterprise market, and therefore a smaller market commands a higher price premium to help fund the development of SSDs in that space. Or you could assume that the Retail SSD market commands considerably more volume than the other verticals.
Let’s take a look at the market size of each SSD vertical to see what the data shows.
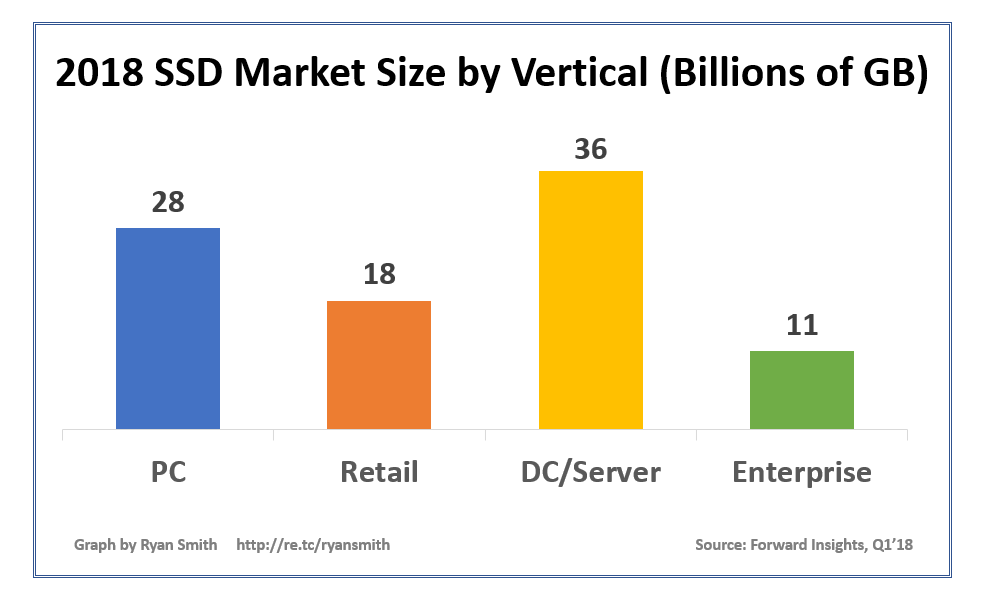
Well, it looks like the Datacenter market is actually the largest. Therefore, DC SSDs should actually be getting the best pricing structure. They should be getting retail like SSD pricing (at $0.21/GB), if not better!
The Enterprise Storage market isn’t small either. 11 billion GB’s! If you go back just three years, in 2015, all verticals were less than 11B GB’s. So, the size of the Enterprise market is huge as well.
Additionally, with the amount of spend on SSDs by the major players in the DC and Enterprise space, there is no reason they shouldn’t be getting retail like SSD pricing. In fact, it’s more profitable for the NAND suppliers to do this anyway!
Summary
In closing, you should use retail SSD pricing to guide you in how to price the SSDs you are buying in your vertical. The fact that your vertical has over-provisioning, higher cost SSD controllers, etc is all meaningless when it comes to $/GB at the capacity points you are buying at today. Additionally, the size of your market is big enough to wipe away any niche pricing that has existed over the past decade. Hyperscalers are now demanding the same $/GB no matter what capacity and interface is used; this article outlines why their demands are warranted.
Start acting like a NAND Flash “Billionaire” and use this cost structure and average capacity information to command lower pricing in your vertical.
As always, I hope you have gained knowledge thru this article and I would absolutely love to hear your feedback on this new way of looking at pricing.
Check out my free Online SSD Cost/Pricing Calculator

I have been around IT since I was in high school (running a customized BBS, and hacking) and am not the typical person that finds one area of interest at work; I have designed databases, automated IT processes, written code at the driver level and all the way up to the GUI level, ran an international software engineering team, started an e-commerce business that generated over $1M, ran a $5B product marketing team for one of the largest semiconductor players in the world, traveled as a sales engineer for the largest storage OEM in the world, researched and developed strategy for one of the top 5 enterprise storage providers, and traveled around the world helping various companies make investment decisions in startups. I also am extremely passionate about uncovering insights from any data set. I just like to have fun by making a notable difference, influencing others, and to work with smart people.