
When I first entered the workforce, I was always curious to know how much people made. I don’t remember why, but it probably had something to do with wondering what I wanted to be when I “grew up”. Since I’ve been diving deep into Pure Storage (PSTG) financial statements, I’m going to take the opportunity to explore how to go from public financial statements to figuring out the compensation of their Sales & Marketing (S&M). In other words, we are going to find out what their S&M employees are getting paid (what they actually see on their paycheck). In addition, this data can be used to benchmark your company against Pure Storage, by normalizing it on a per employee basis.
In a previous post, I was able to discover the overall S&M expense of salary, bonus, commission, and stock being paid is, from Pure Storage’s perspective.. So why couldn’t I translate this into what the average employee gets paid at Pure Storage? That’s what this post is about. Oh yeah.. my 20 years-ago self would be giddy right now.
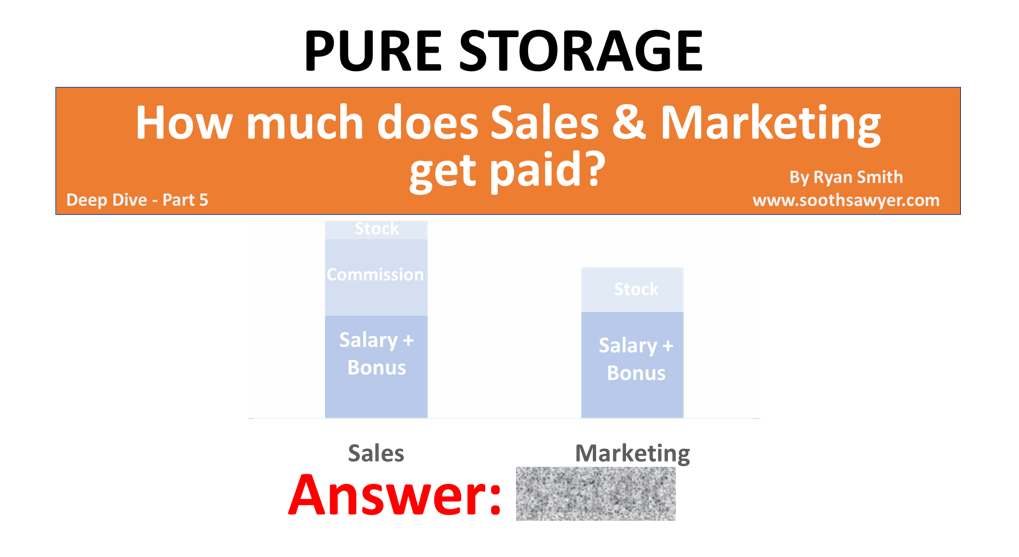
For those that aren’t the curious type (to see how I got there and therefore how you can), I’m just going to show you the end result here. But I still encourage you to read the rest.. as I try to make the process fun and repeatable for any company you want to analyze.
Please read my entire disclosure at the bottom of this post. A quick version: I work for various companies, although this post has absolutely nothing to do with my employment there.
Here is what the average Sales & Marketing Employee at Pure Storage is making:
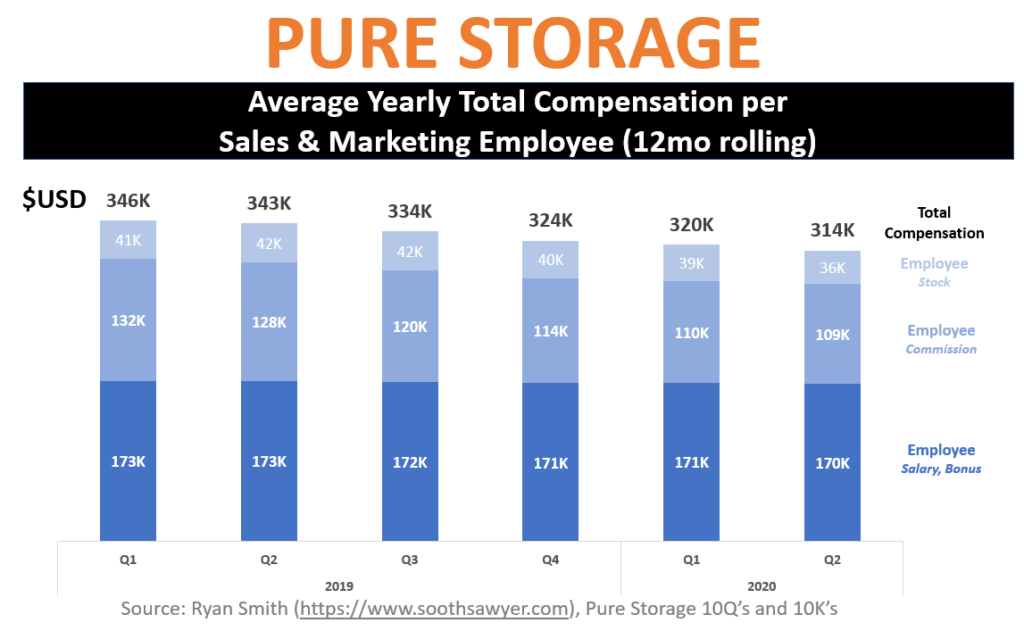
As you can see, the average yearly compensation package for each Sales & Marketing employee is $314,000 (this has been declining, from what appears to be mostly due to commissions); this may be an artifact of the change in revenue recognition caused by Pure Storage’s transition to ASC 606 in February 2018, or it could be due to declining ASP’s.
Also keep in mind that this figure blends the Sales and Marketing teams together and it’s hard to tease out specifically how much Sales makes versus Marketing, but according to LinkedIn, roughly 85% of their S&M staff are in the Sales department. Using this and other data, I will attempt to model out an example of what Sales makes versus Marketing in this post.
The rest of this post will show you how I got to this, as well as give you some useful comparisons against Pure Storage’s competitors. After reading this, you will hopefully learn some quick tips to ball park other companies’ employee compensation.
Let’s dive into the details
In the first and second part of my deep dive on Pure Storage (PSTG), I broke out their Sales and Marketing expenses, as well as their employee distribution by department. By combining these two sets of data, we can look at the total S&M expenses, averaged out for each S&M employee.
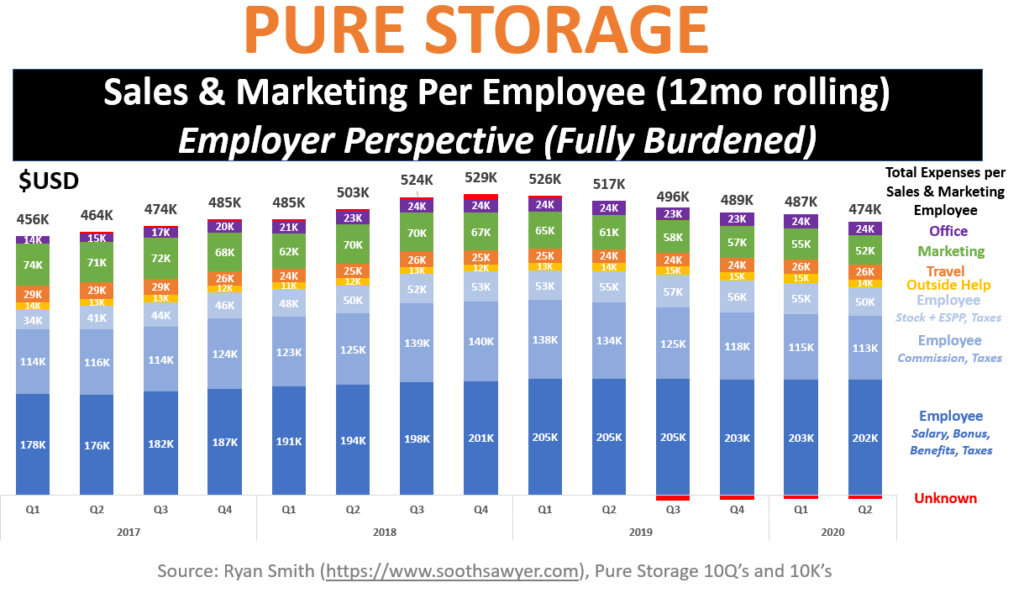
You can see that a majority of the expenses are labor costs, which is no surprise. On average, Pure Storage is spending about $474K per year for each of their S&M employees. Keep in mind that this is the “fully-burdened” expense which means this is “all in” with things like: Benefits, employer taxes like Social Security, Medicare, Unemployment, Office Space, Travel, etc.
We can also see that Pure spends about $2.2K/month ($26K divided by 12) on travel for its S&M employees.
Looking at Employee Compensation
Okay, let’s start getting closer to what employees see on their Pure Storage compensation plan. To do this, first we will only look at the direct to employee-related compensation (salary, bonus, commissions, stock). Then we need to start pulling out benefits and employer-side taxes out of the employee-related compensation. To do this, I looked up tax law for what employers must withhold for Social Security, Medicare, and unemployment taxes, and looked up what an employer would typically pay for benefits (medical, dental, life insurance, etc) by looking at real world examples. This allowed me to come up with the below chart:
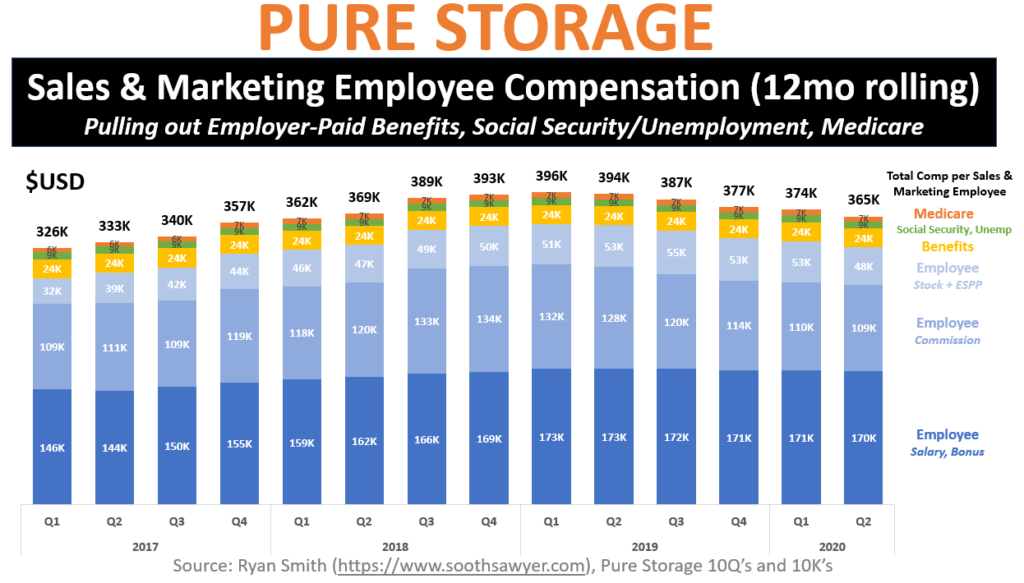
Great! We have now taken the $474K/year fully-burdened expense per employee down to $365K/year. Of that amount, roughly $40K of this employee compensation is going to benefits and taxes; This is something employees don’t typically see or directly care about.
Now that we have broken out employer-related employee expenses from the compensation, let’s just look at employee compensation, from the perspective of the employee:
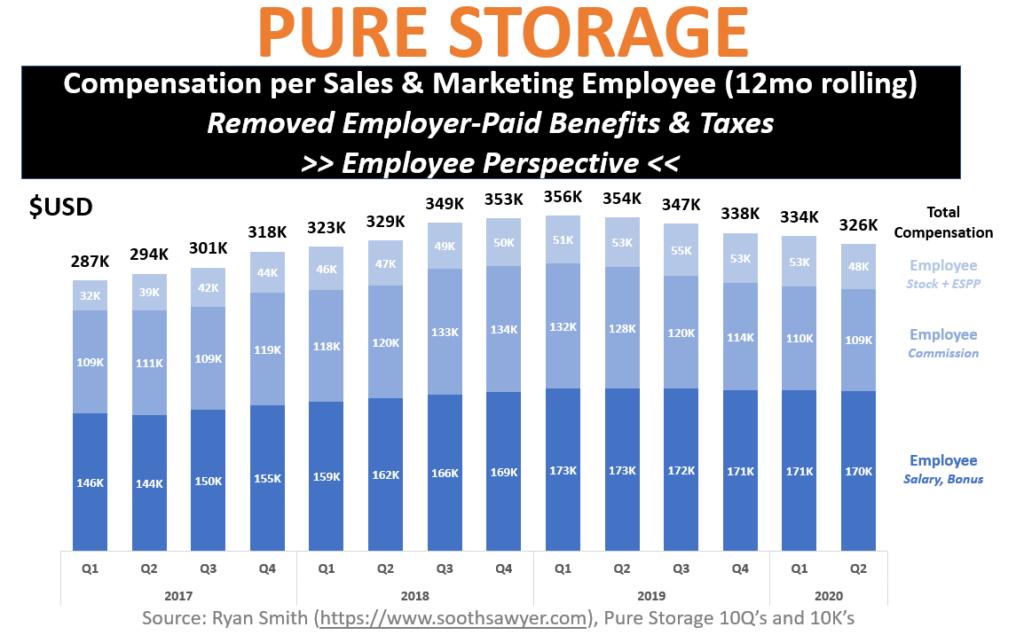
As you can see, we have now taken the $365K/year per employee down to $326K/year. This is what the employee would actually see on their W2. However, within stock-based compensation is ESPP (Employee Stock Purchase Plan) which is typically not considered part of a compensation package of employees; this is typically in the benefits provided by the employer. So, let’s yank out ESPP.
To do this, I used the average ESPP expense that Pure Storage incurs for all of its employees (that I detailed in Part 4 of my deep dive). This comes out to about $12K/year but varies depending on the quarter which I account for in my model. By taking out ESPP, I ended up with the following compensation package for the average Sales & Marketing employee at Pure Storage (same chart from the beginning of the post):

We went from $474K to $365K to $326K, and finally to $314K! So, the average Pure Storage Sales & Marketing employee compensation package is $314K/year. We made it!
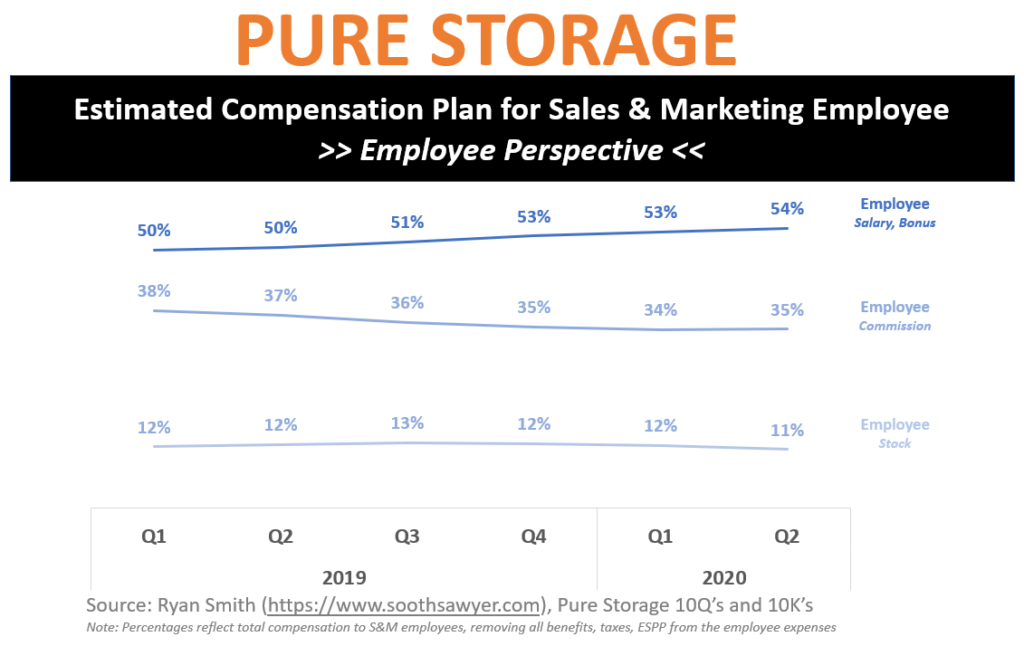
Sales & Marketing Comp Plan (Average)
Looking at compensation, in terms of percentages, you end up with 54%, 35%, and 11% of the compensation coming from Salary/Bonus, Commission, and Stock, respectively:
Sales vs Marketing Ratios
As I mentioned earlier in this post, this is a blend of Sales & Marketing employees. I would expect Marketing employees aren’t compensated on commission so it would be nice if we could tease out what Sales makes versus what Marketing makes. I cannot do this based on Pure’s financials alone. To do this, I looked at the function of employees at Pure Storage, on LinkedIn, and came up with the following split of Sales vs Marketing:
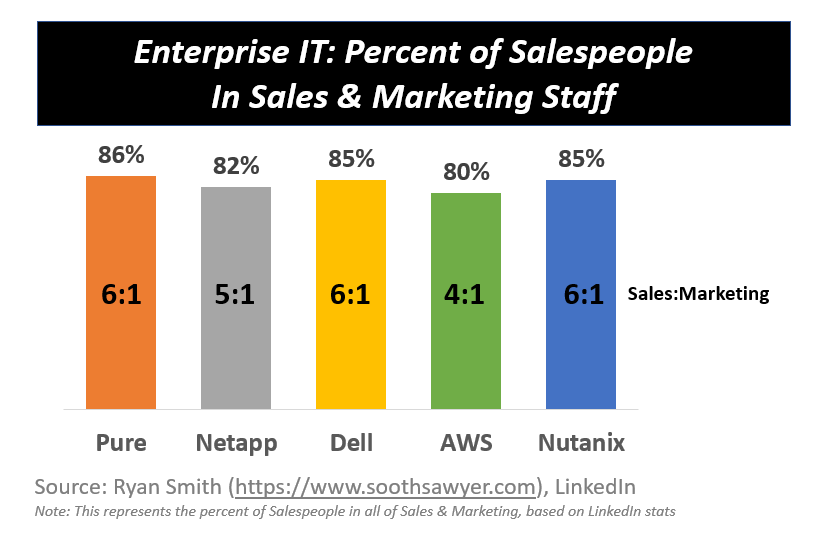
For the companies I looked at, they appear to have normalized on a ratio of Sales to Marketing employees of 5:1 to 6:1. This is a useful ratio to be aware of when comparing your own organizational structure.
Additionally, this chart shows that most of the S&M staff are sales-related at Pure Storage, with it representing 86% of their overall S&M employees. This means there is a heavy portion of the S&M compensation going to Sales and this will skew the overall averages towards salespeople compensation.
Sales vs Marketing Compensation Plan (Split)
Assuming that commission-based compensation only go to salespeople, and coming up with some reasonable compensation splits that allow the overall totals of stocks and salary to come up with the totals outlined in the Pure financials, I came up with the below educated guess as to their compensation plans for both Sales & Marketing:
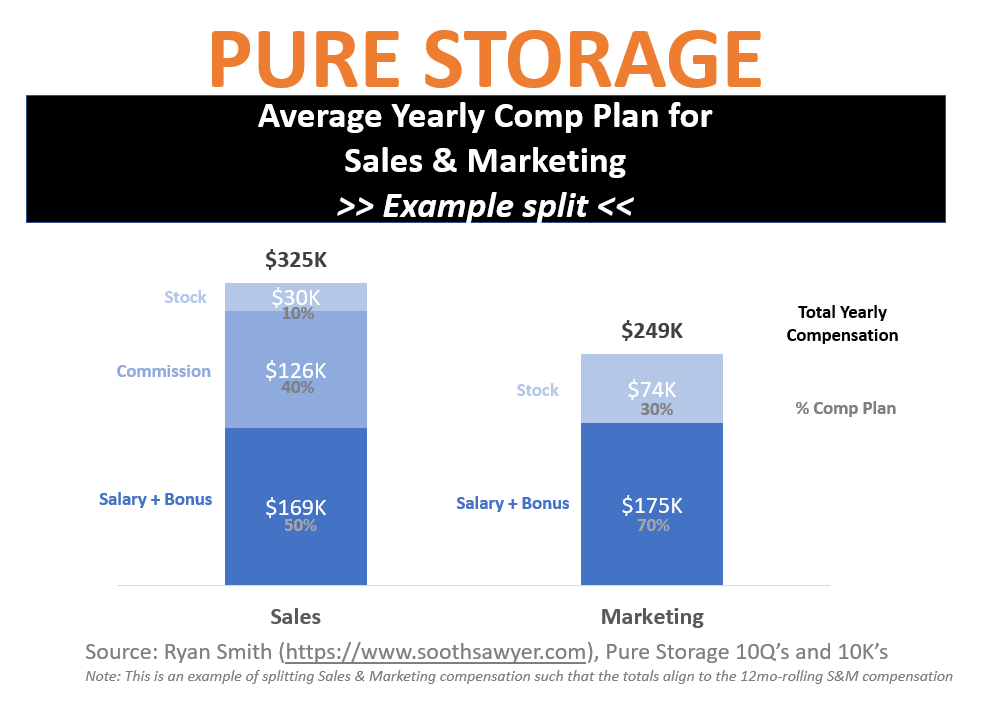
Keep in mind that this is an example that allows the math to still come out to the totals outlined in Pure’s financials. There are only so many ways this can be modeled based on having it align to the totals. However, if I had a better idea of roughly what the compensation splits were for Sales and separately for Marketing, I would be able to model this more accurately. On Glassdoor, I did see some statistically insignificant data showing a roughly 45/45/10 split between Salary/Commission/Stock for Sales people but I couldn’t make that work out to the same overall totals; However, 50/40/10 did work for Sales as I outlined in the chart.
So, my guesses for the average compensation for Pure Storage are:
Sales: $325K/year (50/40/10 split between Salary+Bonus/Commission/Stock)
Marketing: $249K/year (70/30 split between Salary+Bonus/Stock)
Some Quick Fact Checking
Since this is my first time taking publicly available financial statements and coming up with employee compensation figures, I definitely wanted to have some type of confidence in my findings before sharing this with you. To do this, I talked with a tech-veteran CFO that provided me with some rough guidance on taking the total employee-related compensation figures and getting to what the employee would actually see on their compensation plan. So I asked, “What is the typical overhead of benefits and taxes when looking at the total employee-related compensation figures in a financial statement?” Without hesitating, he provided me a 12% figure.
With that, let’s see how we did:
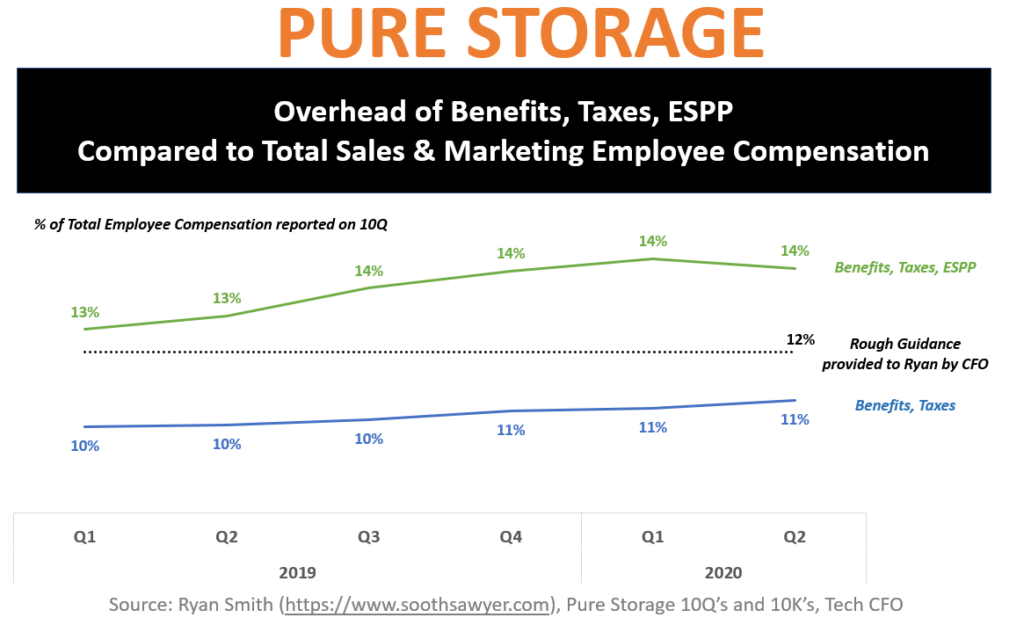
Wow, we did pretty well. Just looking at Q2’FY20, if I take the original $365K/year 12-mo trailing figure that goes to employees through salary, bonuses, commissions, and stock, we end up with between 11-14% ($40K-51K) going to benefits and taxes, depending on whether you include ESPP.
Instead of doing all this work I did, even just taking the ballpark of 12% would have made these expenses at $44K which would have been good enough. So, if you know what the employer’s perspective of employee compensation is (like I figured out in Post 2 and divided by number of S&M employees in this post), you could quickly find out what the average employee compensation is. Good to know. 🙂
Employee Burden Rates
Now let’s look at what Pure Storage’s burden rates are for employees. There are two types of rates I’m going to look at here.
Employee Fully Burdened Rate
The Fully Burdened Rate is taking the total topline Sales & Marketing expense (this is super easy to grab from any Pure Storage 10Q/10K statement) and seeing how much of those expenses are “overhead” that don’t actually go to the employee in the form of compensation.
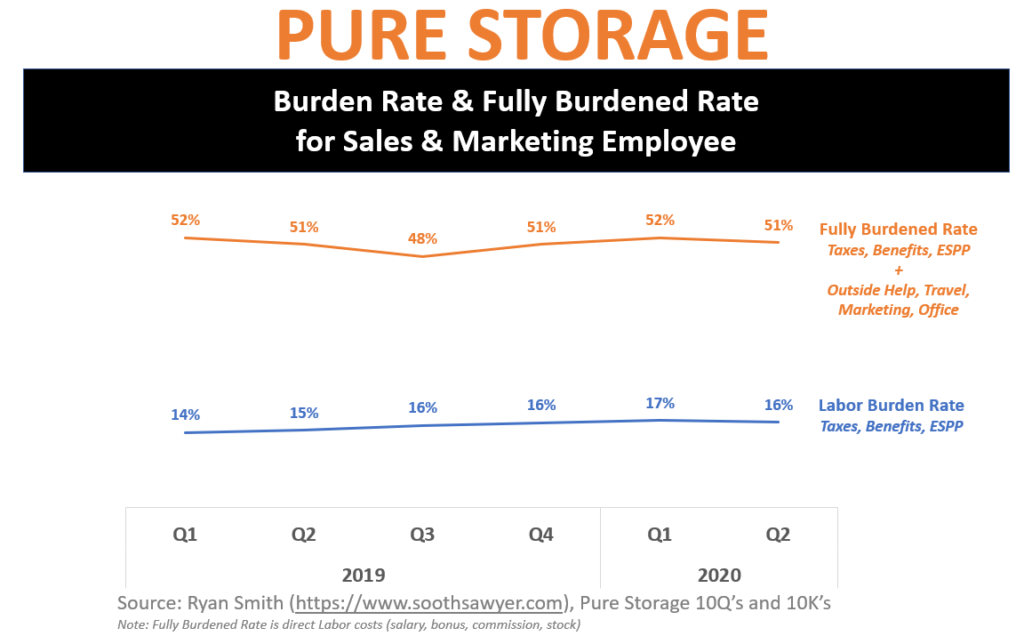
Looking at Pure Storage’s figures, the total for employer taxes, benefits including ESPP, consulting services, travel, marketing and office amounts to roughly 51% of their total S&M expenses.
That means that if you were to take the $314K/yr total 12-mo trailing employee compensation that we calculated and multiplied that by 51%, $160K/yr goes to overhead. The total of the two is $474K which is the number we started with for S&M expenses per employee.
Conversely, if you want to start with the total Sales & Marketing expense on their financial statement, you would simply take the $474K (12mo trailing figure) and divide that by 1.51 to come up with the $314K/year that the employee makes. Nice shortcut for ballparking future reports.
So, at Pure Storage the “fully burdened” employee costs are 1.51x compensation.
Labor Burden Rate
Another figure that is often looked at is Labor Burden Rate. This is the overhead of employer-paid taxes and benefits, including ESPP. From the chart above, Pure is sitting at roughly a 16% labor burden rate. In other words, for the average employee pulling in $314K/year, the employer has to pay and additional 16% towards employer-paid benefits and taxes, which equates to $50K/year.
Summary
Well, this was fun. We just took a journey of taking publicly provided financial reports and found out what an average employee in Sales & Marketing at Pure Storage makes, the amount they travel, the fully burdened cost, labor burden rate, and learned a couple shortcuts along the way to do some quick calculations in the future.
I hope you enjoyed. As always, if you spot any problems in my analysis or findings, don’t hesitate to publicly shaming me in the comments or privately through the contact page.
-Ryan
A not-so quick disclosure: I work for various companies. However, this fact has nothing to do with this post because I have not been asked by anyone or any organization to analyze or publish my findings here with you. Others watch TV at night.. I watch data. And when I share my thoughts, they have no intent (so please don’t make up a story as to the intent) other than satisfying my urge to share ideas/thoughts..that’s it. I must also state that my views here in no way reflect that of my employer. Additionally, do not use any of this information to make financial decisions; treat this as for entertainment purposes only. The intent here is to see what kind of cool things easily available data can tell us, and this month it happens to be Pure’s financials. Additionally, Pure is an amazing company, just like all companies, and I wish them the best in their journey. Also keep in mind that everything posted here is based on my own model and could be completely off due to a miscalculation or misunderstanding of the data so please do not make any decisions on this data.

I have been around IT since I was in high school (running a customized BBS, and hacking) and am not the typical person that finds one area of interest at work; I have designed databases, automated IT processes, written code at the driver level and all the way up to the GUI level, ran an international software engineering team, started an e-commerce business that generated over $1M, ran a $5B product marketing team for one of the largest semiconductor players in the world, traveled as a sales engineer for the largest storage OEM in the world, researched and developed strategy for one of the top 5 enterprise storage providers, and traveled around the world helping various companies make investment decisions in startups. I also am extremely passionate about uncovering insights from any data set. I just like to have fun by making a notable difference, influencing others, and to work with smart people.
How does Nutanix compare vs Pure Storage on SBC?
Actually, Nutanix and Pure are both at similar SBC ratios. It could be that the younger age of the companies dictates a higher SBC ratio or Pure is borrowing some operational model from parallel industries; Nutanix is not a traditional storage provider like Pure. Although Pure went all in with all-Flash, their box acts and smells like a traditional array. In any event, further relatively easy research would be needed to pinpoint whether this high of an SBC is warranted at Pure.