

Pure Storage [PSTG] was founded in 2009 and came out of stealth in 2011 as an Enterprise Storage provider. Pure is known in the market for early innovation around NAND Flash in Enterprise Storage Arrays w/ Data Reduction and a unique go-to-market strategy. However, now every vendor has Flash and Data Reduction technology, and has since adjusted their go-to-market strategy. Therefore, each dollar Pure comes by is harder than the next, and their financials are starting to show that.
So, I decided to pour through their 10Q’s, 10K’s, and LinkedIn data to look at what is going on at Pure. This is the first post of a multi-part series diving into Pure’s business.
I would like to be clear that this post is not attempting to be critical of Pure Storage’s products or employees and instead is trying to look at what their financial data is telling me about their business and their future. I would also like to state that at the time I wrote this I worked for a competitor of Pure Storage but this article in no way expresses any opinions of my employer and only represents my own personal thoughts).
This post will analyze the following:
- Pure’s non-GAAP view on Quarterly Revenue vs expenses
- My non-GAAP view (adding back in Stock-based Compensation) on Revenue vs expenses
- Income from Operations
- Never before provided headcount/employee demographics
- Comparison of headcount versus peers
Update: The second post detailing Sales & Marketing Expenses is now live.
Update: The fifth post shows how much each Sales & Marketing employee is getting compensated.
Let’s get started…
Revenue vs Expenses (Pure’s view)
Every quarter, Pure posts their 10Q’s and hosts a call with analysts. They put together pretty presentations to help tell you their story, the way they want it to be told.
I do have to admit, Pure provides a lot of details in their 10Q’s and 10K’s that many other public companies don’t provide; Many of which has allowed me to provide this write-up as well as future posts where I will dive into more detail.
Their operating model/profit that they always present are non-GAAP versions that omit SBC (Stock-based Compensation). You see, “non-GAAP” allows any company to spin (aka market) their financials any way they want. And oftentimes, people (even smart ones) take it for face value as fact, assuming there are checks and balances around public companies. Let me be clear.. there is nothing unethical about the spin Pure puts around their non-GAAP story.. It’s just that non-GAAP can omit large expenses that can change your perspective. Let’s take a look at what I mean. First, let’s look at the non-GAAP perspective.
NOTE: To be clear, Pure is fully complying with SEC requirements and discloses reconciliation of GAAP and non-GAAP versions of their financials and I am in no way implying there is unethical behavior here.
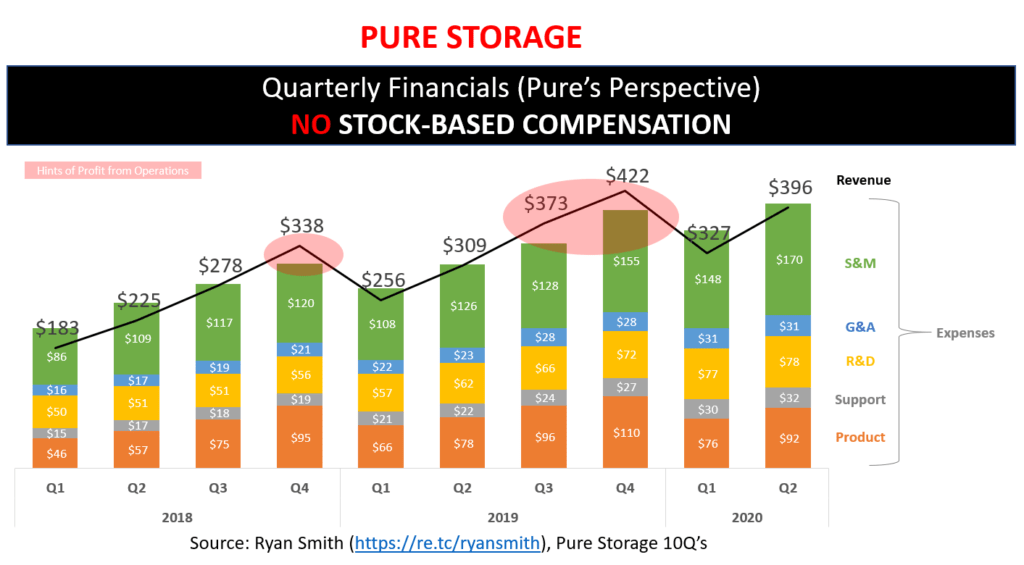
Quarterly Non-GAAP Revenue vs Expenses (based on non-GAAP methodology):
Can’t see the image above? Click here
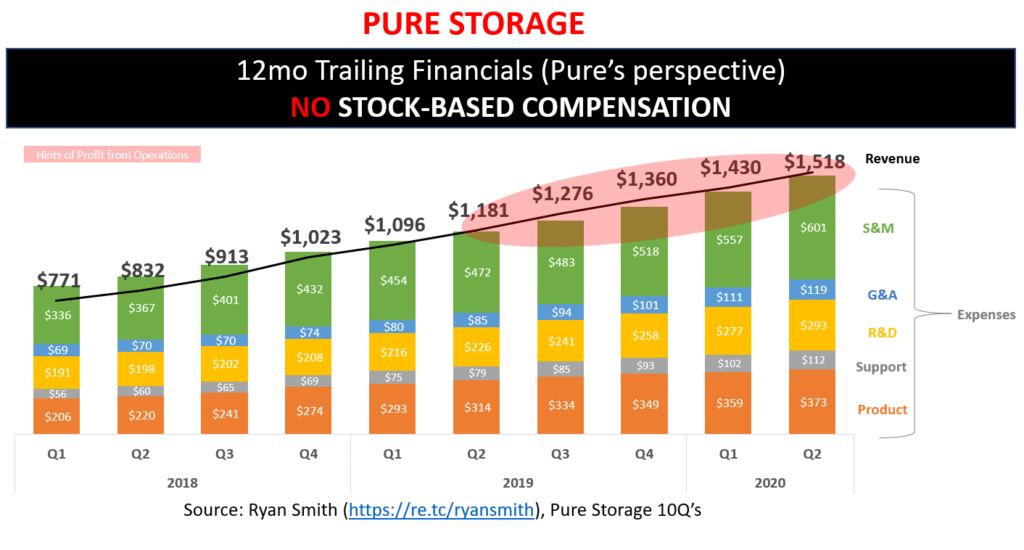
I prefer to look at 12mo trailing view to remove seasonality to easily see trends within a business (I’m a simple-minded person).
This is the same data as above but looking at it from a 12mo trailing perspective:
Can’t see the image above? Click here
Keep in mind that I’m not including the removal of taxes related to Stock-based Compensation (SBC) and amortization of acquired intangible assets, both of which are insignificant. I just wanted to mention that in case you see ever so slight differences from what Pure reports in their non-GAAP version.
Looking at these charts which closely mimic the non-GAAP version provided by Pure, it looks like they are hitting positive operational profit. However, the non-GAAP version presented in their presentations are omitting a very large expense: SBC.
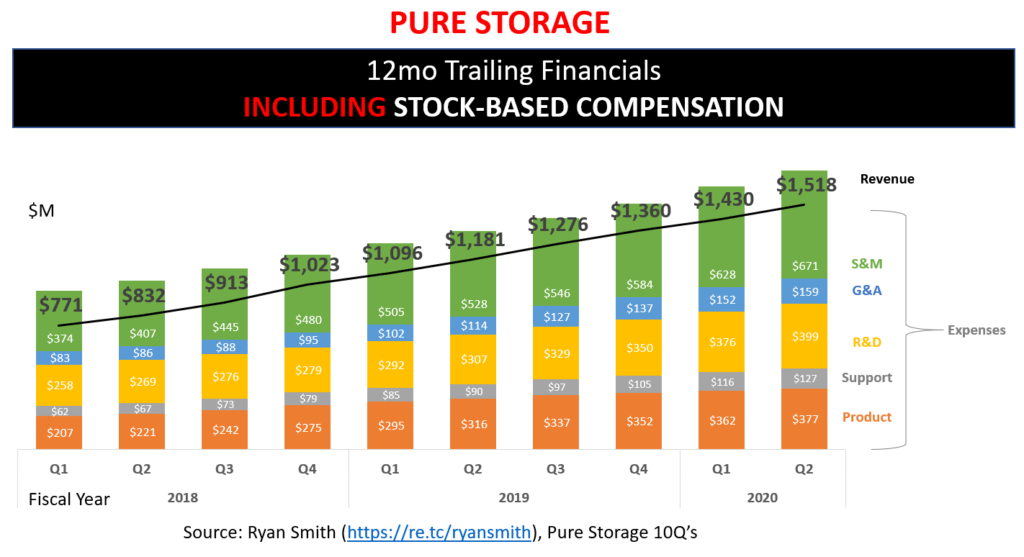
Revenue vs Expenses (adding back SBC expenses)
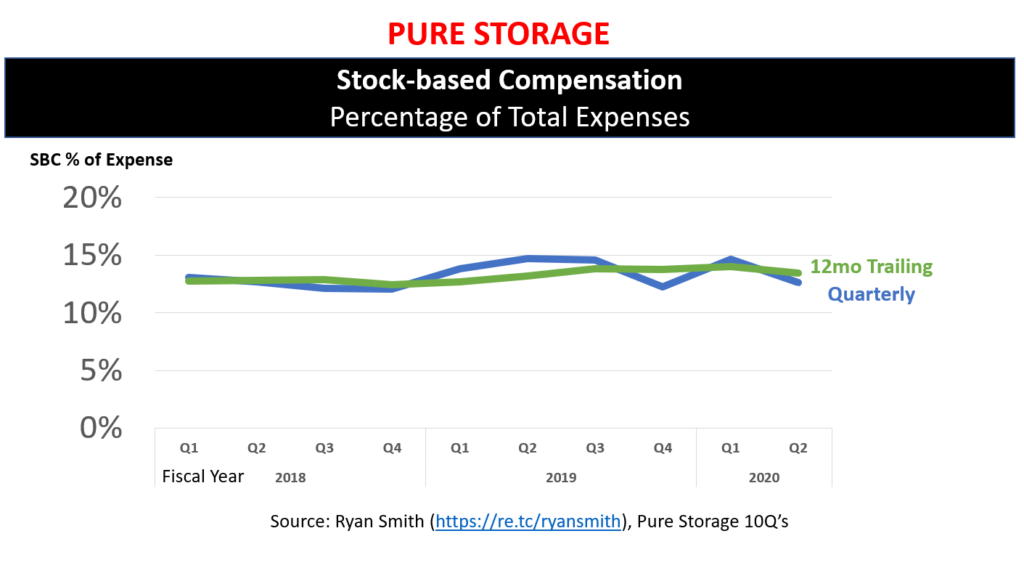
Everything I covered thus far excluded SBC (Stock-based Compensation) expenses. SBC is roughly 14% of Pure’s overall expenses ($60M/quarter) so it’s not insignificant. However, the non-GAAP version used in Pure’s presentations omit this from their operating model (expenses and margin calculations). You will see references on Page 13 of their Q2’20 presentation that SBC cannot be reasonably predicted. However, when I was looking at SBC as a percent of all expenses, it looks rather predictable; In fact, even their quarterly figure closely hugs the 12mo trailing average which shows seasonality is not as much of a factor in predicting this.
Can’t see the image above? Click here?
Nov 11, 2019 update: The above chart shows stock-based compensation at ~15% of expenses. Note that the total expenses in this chart included cost of revenue so the SBC % of just operational expenses is actually higher, at around 20% of expenses. You can see stock-based compensation in more detail in my Part 4 of this deep dive.
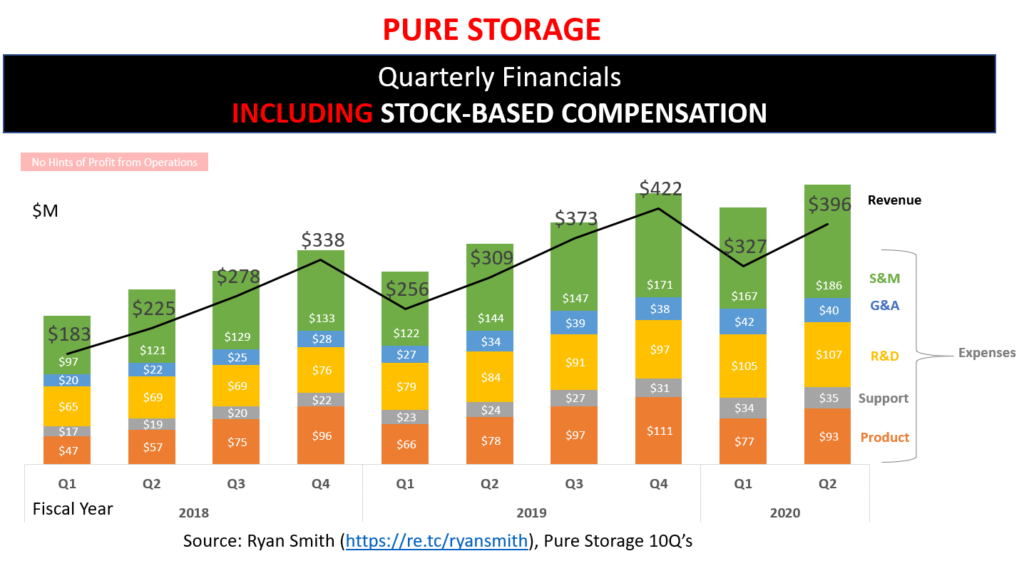
So, let’s add SBC back in. After all, if we didn’t have to include it in our Operational model, why doesn’t every company just make SBC 50% or 70% of their expenses and conveniently exclude it from their model and show massive operational profit to its investors. I know, a hyperbole, but if it’s part of your compensation package, I believe it should be included. However, please note that many public companies ommit SBC from their non-GAAP version and further investigation would be needed to see if the SBC is a higher percent of expenses than their peers. Whatever your thoughts are about excluding SBC, having SBC can potentially dilute the equity of investors so it should be considered an important measurement in any company’s Op Model.
Can’t see the image above? Click here
Including the predictable SBC expense, Pure has not yet been profitable from their Operations. As I mentioned before, I like to look at things in 12mo periods to simplify trends for my simple mind:
Can’t see the image above? Click here
My hypothesis is that there may need to be improvements in the productivity figures of the sales team to make it a profitable company. We’ll dive in deeper on this in my next post to see whether this proves true or not.
Let’s take all of the charts above and look at just the profits from operations.
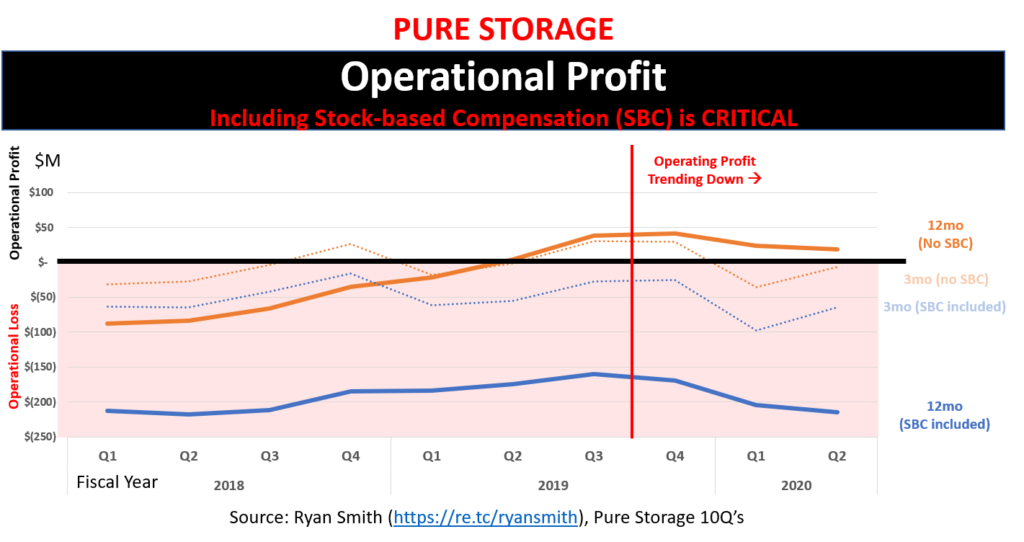
Can’t see the image above? Click here
It looks like Pure was trending towards becoming profitable no matter how you look at it (SBC expenses or not). However, that appears to have started trending the wrong way starting in FQ4’19 (Calendar Q4’18). It looks like they may need to add $50M in operational profit per quarter ($200M/yr) to break even. A side note: a lot of their climb towards profitability seemed to coincide with the NAND Flash Shortage which may show an extreme vulnerability to the volatility of the semiconductor business in which most of their bill-of-materials (BOM) is based; If I have time, I may cover some of the trends that show you more of this correlation; Pure actually appears to perform inversely to the trends in NAND (more thoughts on this in the future).
Ok, I need to get onto some fun stuff that lets me segue to my next post.
Pure Storage Employees
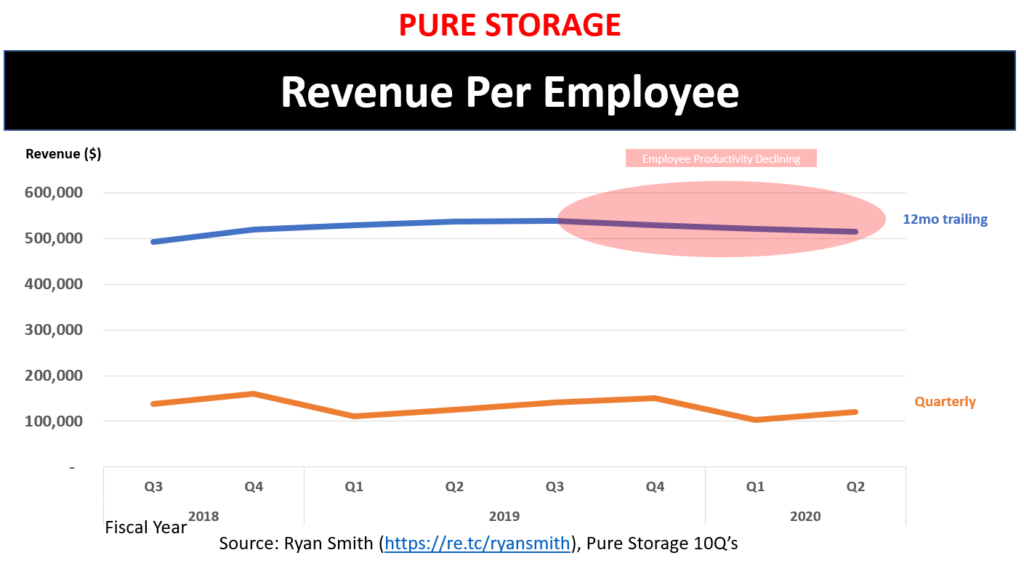
When looking at Pure’s financial data for revenue over a 12mo period, it all looks up and to the right. However, things change if we can average that out by employee and start looking at the productivity as the organization matures.
Just to give you a hint of what I mean, using information provided by Pure’s 10Q’s, here is their Revenue per Employee:
Can’t see the image above? Click here
Over the past three quarters, the chart seems to indicate that Pure has plateaued on it’s employee productivity numbers. This typically means that a company isn’t able to keep adding employees without having the same impact of negative operational profits. And having it decline doesn’t help. What a management challenge (the fun kind).
Moving on.. wouldn’t it be cool if we could look at productivity levels of the sales and marketing teams? We could start to understand some of the casual comments by executives on the Pure quarterly investor calls about how they aren’t happy with the productivity of some of their newer sales cohorts.
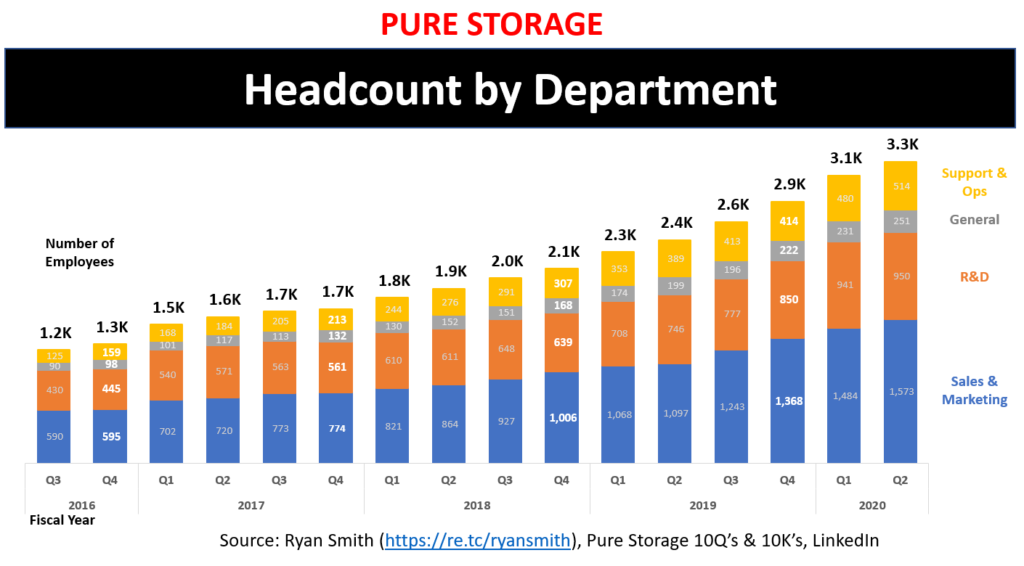
To do this, I had to pour through Pure’s 10Q’s, 10K’s, LinkedIn data, job postings that liberally posted sales employee headcount, and using a small portion of my brain to synthesize all this data. I’m simplifying this but it’s 99% boring to double click into the details of how I came up with my model. Here is Pure Storage Employee count, by department:
Can’t see the image above? Click here
My confidence is significantly higher on all of the Q4 headcount numbers based on the data I had but I’m still fairly confident in all of the headcount numbers, as you will see based on comparisons to LinkedIn data in a little bit.
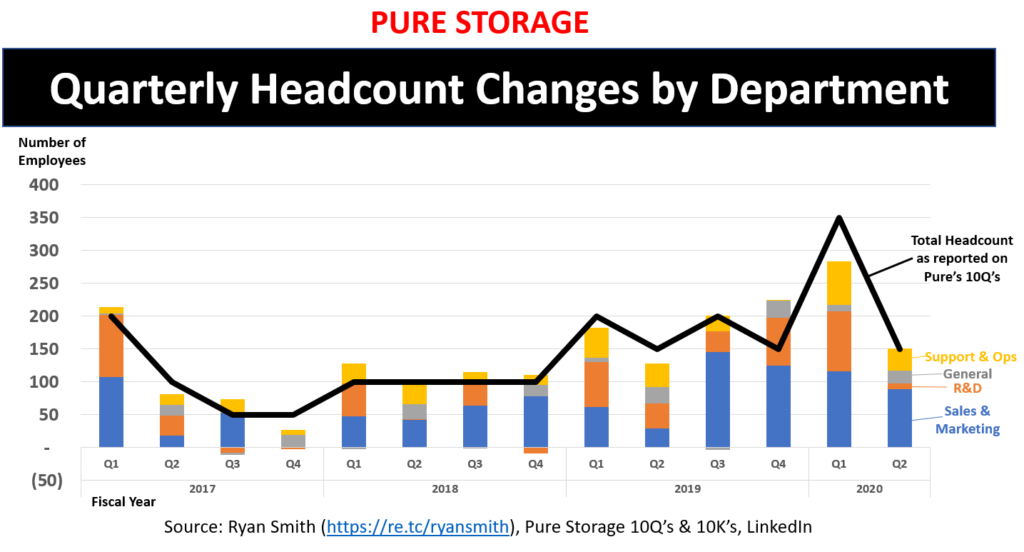
Can’t see the image above? Click here
As you can see, my model isn’t perfectly aligning to quarterly changes in headcount but the net is pretty spot on. The black line represents total headcount changes as reported in Pure’s own 10Q’s. The breakdown in the bar charts is my model. Pretty damn close.
Now, let’s compare my model versus what LinkedIn reports and at the same time compare Pure against their competitors to see if they have a different hiring strategy.
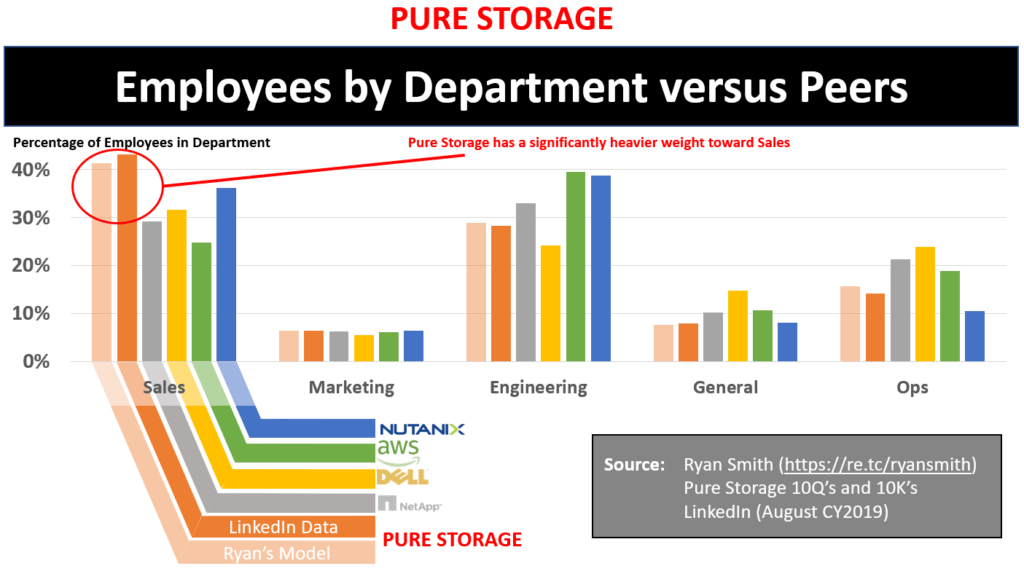
Can’t see the image above? Click here
Note: The light orange is my model and the rest is all LinkedIn data. Since Pure’s 10Q and 10K data lumps Sales and Marketing together, I assumed the marketing figure from LinkedIn is fairly accurate and used that for my model’s (light orange) figure for Marketing here (6.5%) and the remainder of the S&M goes to Sales.
Amazing how accurate my model off of 10Q and 10K data is compared to what LinkedIn shows.
Note that my analysis shows that Pure may have a heavy portion of their employees in the Sales department versus their peers. Surprisingly, Pure’s Marketing has a fairly industry standard portion of employees in it.
Just for fun, let’s look at the geographic distribution of Pure’s employees:
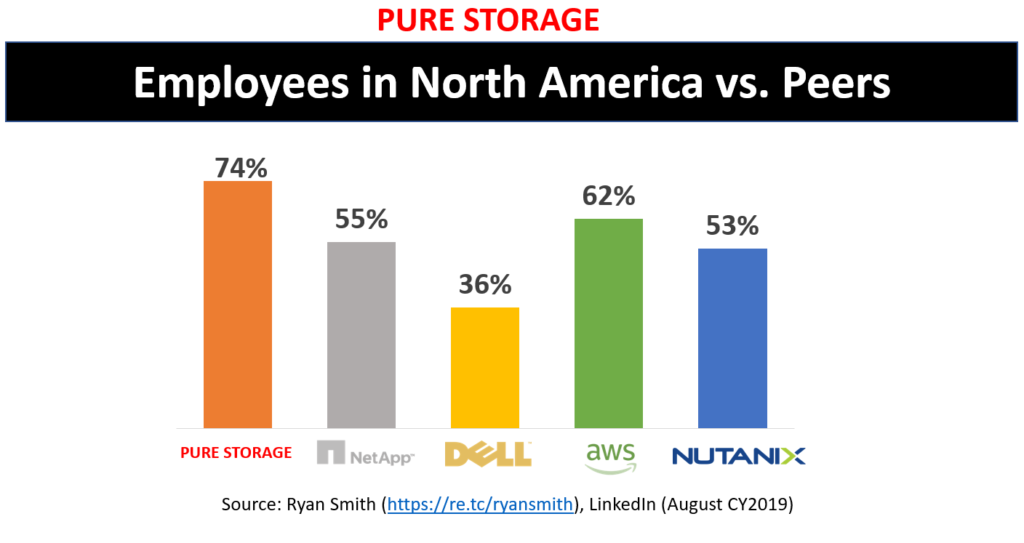
Can’t see the image above? Click here
Now that we have set up a foundation of revenue, expenses, and employee demographics, we will be able to dive deeper into the largest expense at Pure Storage.. Sales & Marketing.
- Never revealed before breakdown of S&M expenses (click here to read)
- Providing quarterly details for: salary, commission, stock, consulting, travel, marketing, and office related expenses
- Break all of this down by sales person
- Sales comp plans and trends (Part 5 is now posted)
- Sales geographic distribution compared to peers (Part 3)
- What departments and regions are they expanding in?
- Revenue per customer trends
- Revenue per salesperson trends (broken down by cohorts) so we can look at productivity trends (Part 3)
- Bonus: If I get to it, I will calculate the sales productivity required (e.g., how much revenue each employee must generate) to overcome the loss from operations Pure seems to be unable to get out from under.
Part 2 of the Pure Storage Deep Dive has been posted. See their detailed Sales & Marketing Expenses by clicking here
Part 3 of the Pure Storage Deep Dive has been posted. See more details into the declining sales productivity trend, where sales people are located, international sales per employee versus U.S., and more.
If you have any feedback on my analysis (good or bad), I always welcome comments. I am writing my analysis in good faith with no intent to mislead readers and am purely looking at data and trying to interpret it. If you feel I have written anything that is misleading, I encourage you to reach out directly.
Until next time!
-Ryan
Disclosure: I work for various companies and my views in no way reflect that of my employer. I also am not an expert in analyzing financial reports but do have a decent head on my shoulders; If you see something wrong in my analysis then please be kind and point it out to me so I can learn from your expertise.

I have been around IT since I was in high school (running a customized BBS, and hacking) and am not the typical person that finds one area of interest at work; I have designed databases, automated IT processes, written code at the driver level and all the way up to the GUI level, ran an international software engineering team, started an e-commerce business that generated over $1M, ran a $5B product marketing team for one of the largest semiconductor players in the world, traveled as a sales engineer for the largest storage OEM in the world, researched and developed strategy for one of the top 5 enterprise storage providers, and traveled around the world helping various companies make investment decisions in startups. I also am extremely passionate about uncovering insights from any data set. I just like to have fun by making a notable difference, influencing others, and to work with smart people.