
If you haven’t read Part 1 or Part 2 of this deep dive, I encourage you to read those as this post will leverage findings from there.
As covered in Part 1 of this Pure Storage Deep Dive, the revenue per employee at Pure Storage has been declining. This data, along with headcount demographics also uncovered in the first post, will allow me to dissect this declining employee productivity trend in a bit more detail.
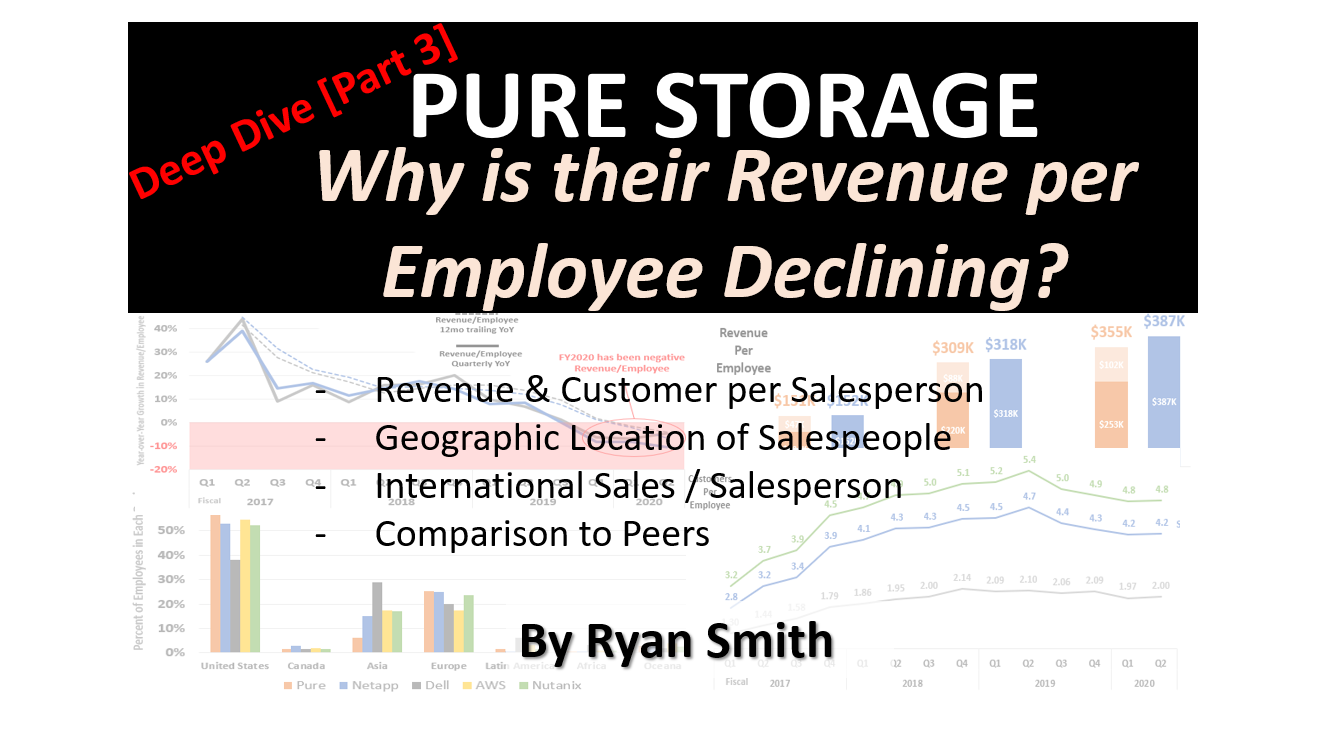
This post (Part 3 of the deep dive) will dive into Pure’s Sales Productivity to see if we can find out a little bit more about what’s going on.
We are finally getting to the good stuff!!
Please read my entire disclosure at the bottom of this post. A quick version: I work for various companies, although this post has absolutely nothing to do with my employment there.
Revenue per Employee
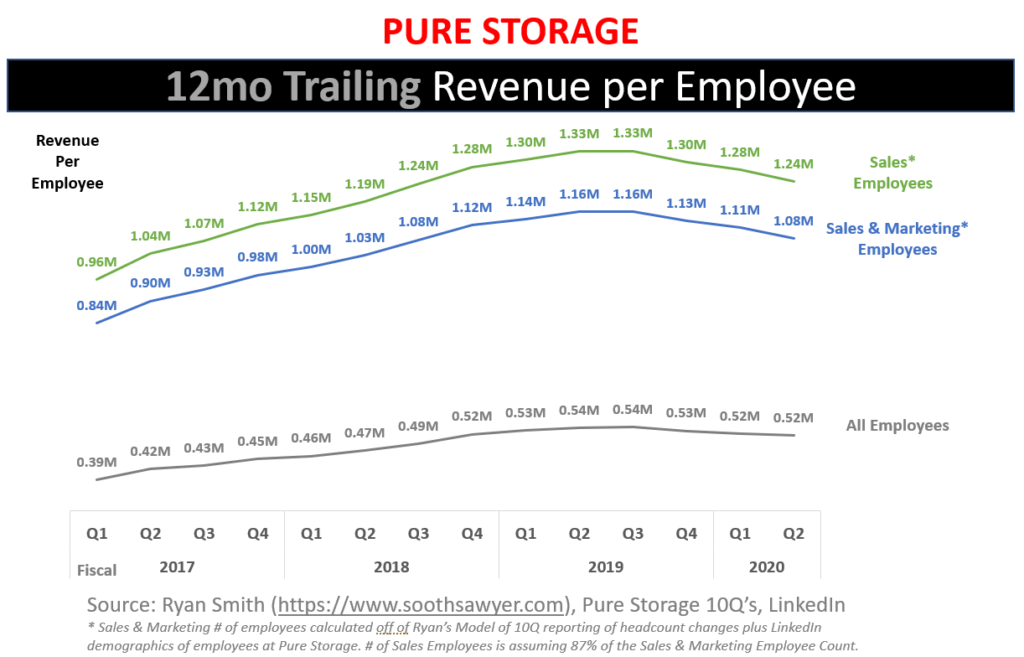
Let’s first take a look at the 12mo trailing revenue per employee at Pure:
Can’t see the image above? Click here
The grey line is the same data from the first post which compares publicly reported revenue divided by total employee count. What I added here was the revenue per Sales & Marketing Employee (based on the headcount demographics from Part 1) [blue line] and then used additional LinkedIn data to calculate out Revenue per Sales Employee [green line].
You can see that no matter how you look at it, sales are declining per employee. This could be due to a number of reasons, including: declining ASPs, units, customers, more deferred revenue, changing from ASC605 to 606 accounting, etc.
Revenue per employee figures, because of the associated costs, are critical to perfect as it lets the management team at Pure see what scaling their current model will provide as they expand the business.
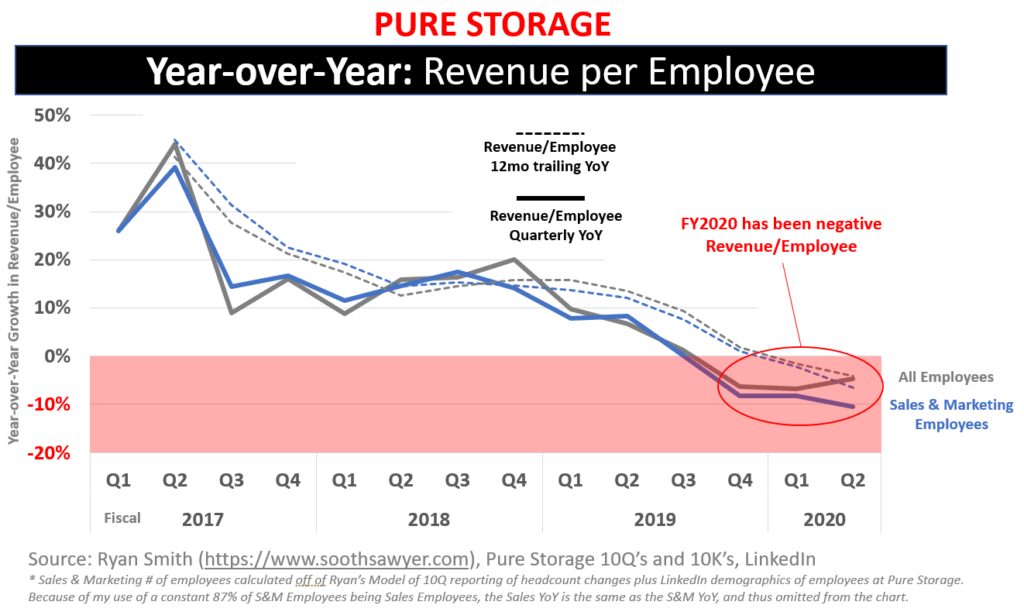
To help you visualize the changes in revenue per employee over time, here is looking at it from a year-over-year perspective:
Can’t see the image above? Click here
The solid lines are quarterly revenue YoY changes and the dashed lines are 12mo trailing revenue YoY changes. The quarterly YoY lets you see more real time what is happening and the 12mo rolling gives you a general trend.
It looks like Pure started encountering negative YoY revenue per employee growth since Q4’FY19 (this translates to Q4’CY18). Keep in mind that this is looking at revenue (not bookings, deferred revenue, etc). Another thing to note is how close the all employee and S&M employee YoY figures mirror each other. Remember that the “All Employee” figure is based off of publicly provided data in the 10Q’s and not based on my model.
Pure Storage Revenue per Employee versus Netapp
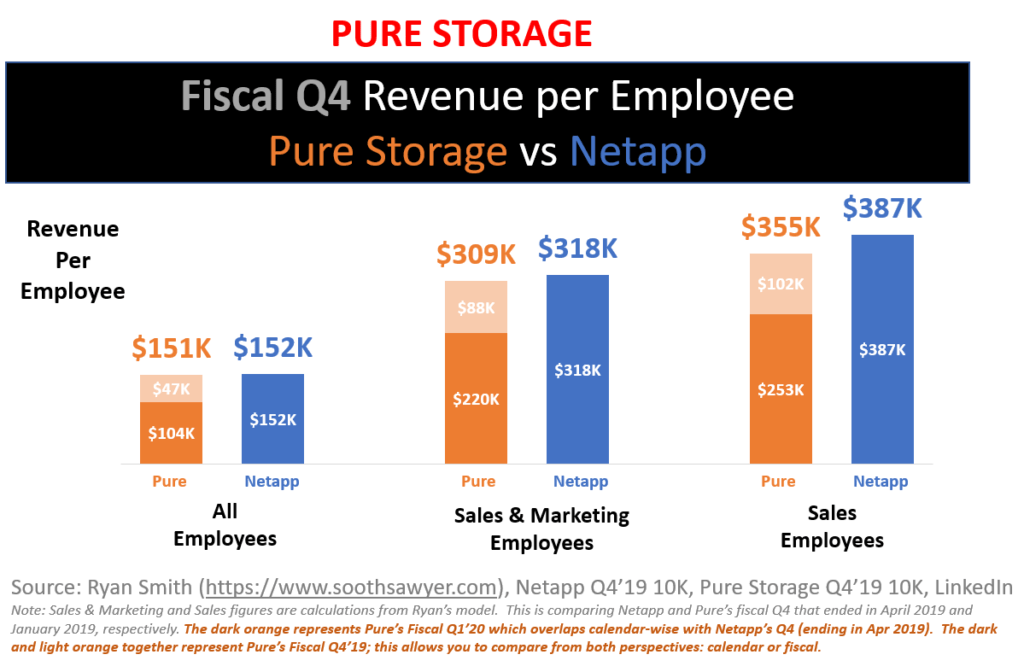
Let’s look at how Pure compares to one of its peers: Netapp. This will let us see a good benchmark to weigh Pure’s numbers against to see if they are under-performing others in their space. It also gives us a realistic idea of what others in the space are achieving, thereby giving us an idea of what Pure should be able to reach as they mature (being that they are now 10 years old).
Can’t see the image above? Click here
I compared Pure versus Netapp from both a calendar and a fiscal perspective. The dark orange is Pure’s Q1’FY20 which aligns (calendar-wise) almost perfectly to Netapp’s Q4’FY19. However, because Q1 is seasonally soft for all companies, I added the light orange portion to allow a FQ4 to FQ4 comparison; otherwise it wouldn’t really be apples versus apples. So, for the purpose of any comments I make, I will be looking at the combined dark and light orange figures which will compare FQ4 for both companies.
As it turns out, the revenue per employee for both companies is pretty close to each other. Netapp has a slight edge when looking at S&M or Sales employees, but not by much. If Pure has plans on increasing the Sales Productivity figures, they are planning on passing up a well established incumbent with a more established customer base.
Will Pure be able to arm their sales people with more products and third party converged offerings that will let them pass up Netapp? Or should we expect the productivity at Pure to level out where it is now?
Now that we see the high level productivity trend, and comparison to Netapp, let’s look at their productivity from a few other angles to see if we can dig in a little more.
Customers per Employee
Let’s take a look at the number of customers per employee. This might help us see if it’s a revenue per customer (covered in a later post) or if it’s a declining customer/employee trend.
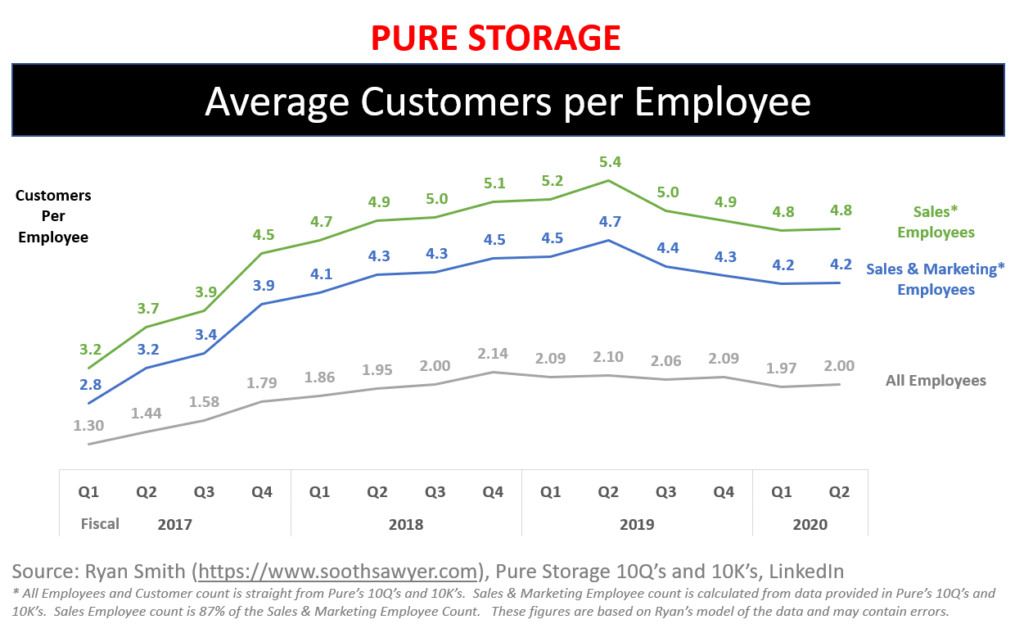
Can’t see the image above? Click here
The grey line represents publicly provided data from Pure in their 10Q’s and this shows that the number of customers per employee was increasing (a good thing) until Q4’FY18. Since then, it has flattened and slightly declined. Additionally, when you use my headcount demographics from Part 1, looking at the customers per Sales & Marketing employee, the declining trend is more pronounced as of Q2’FY19. This may be due to many factors: new sales people not adding customers as fast, new accounts are harder to get into for all salespeople, this data is *all* customers and not looking at *active* customers, etc.
Both revenue and customer per salesperson is very crucial to the op model of Pure, as indicated by the following excerpts from Pure Storage 10Q’s:
From essentially all 10Q’s, every quarter:
“By investing in sales and technical training, demand generation and partner programs, we believe we can enable many of our partners to independently identify, qualify, sell and upgrade customers, with limited involvement from us.”
…
“If we fail to adequately increase revenue and manage costs, we may not achieve or maintain profitability in the future. As a result, our business could be harmed, and our operating results could suffer.”
And as last seen in Q3’FY17:
“However, if we fail to effectively identify, train and manage our channel partners and to monitor their sales activity, as well as the customer support and services being provided to our customers in their local markets, our business, operating results, financial condition and cash flows could be harmed.”
I interpret all this as: We need to increase our sales and customers per employee, otherwise it will severely impact our operational model.
*Newly Hired* Sales & Marketing Productivity
Let’s now take a look at how newly hired Sales & Marketing employees are doing at Pure. This will let us try to see if the productivity is declining for new hires, or the entire employee base.
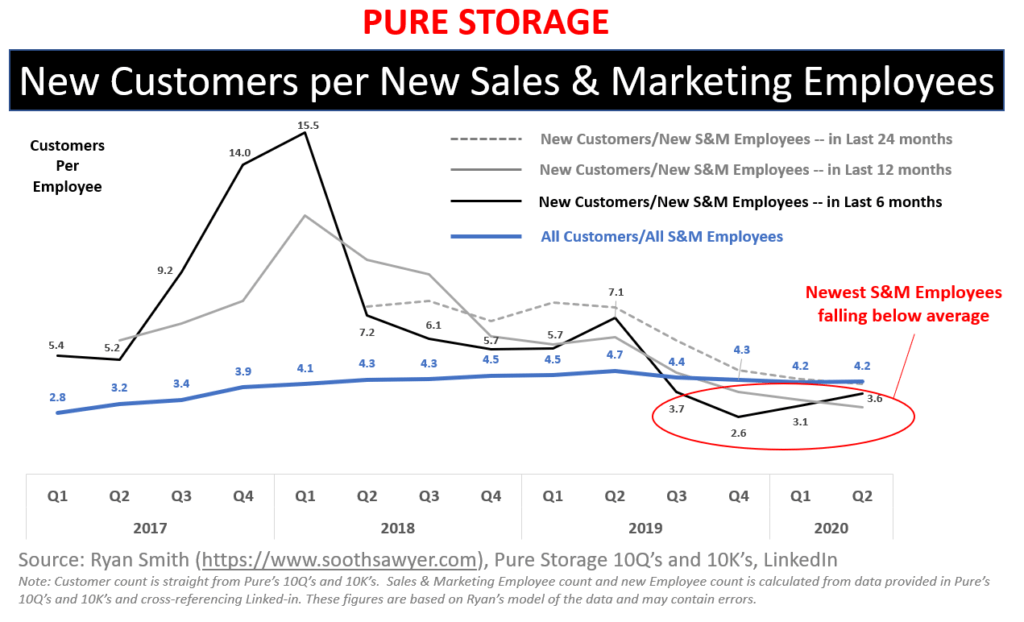
Can’t see the image above? Click here
What I did here was take all publicly stated new customers that Pure has added every quarter and put them into multiple cohorts; I took all new customers added over 6, 12, and 24 month trailing periods, and divided that by the number of new S&M headcount (from my own model) over the same respective periods. Of course, this assumes that all new customers were attributed to the new sales employees but this is what I have to work with; I’m using the same methodology across the quarters shown.
The blue line is the same “Average Customers per All Sales & Marketing Employee” data from the previous chart above; this allows us to compare the new recruits vs the overall sales & marketing population to see if the new population is lifting or lowering the overall average.
As you can see, the newest cohort (S&M employees over the last 6 months) have less new customers per S&M employee than the overall average, which is pulling down the overall average number.
In the Q1’FY20 earning call, Mehdi Hosseini from SIG asked about the sales productivity figures dropping and Charles (CEO) mentioned that this is due to a record number of new sellers in the field, and these start at low productivity and continue to climb.
So, perhaps these productivity figures will eventually start to climb?
U.S. versus non-U.S Sales
Let’s now look at what part of the world Pure’s revenue is coming from. This might let us see if it’s a particular region of the world that is contributing to the decline in sales productivity.
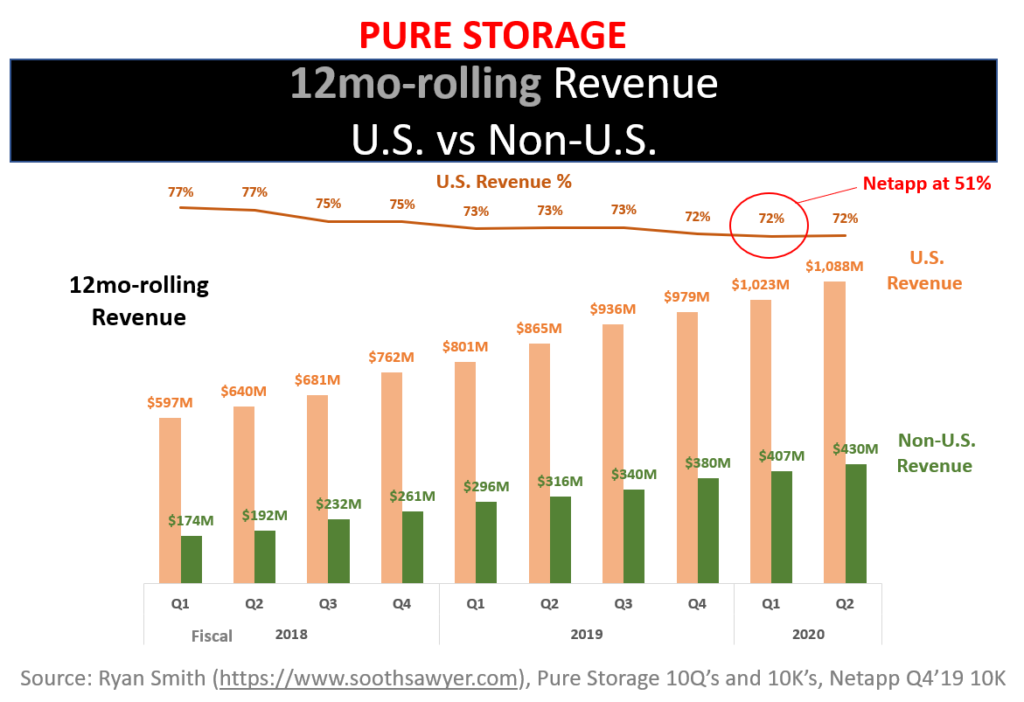
Can’t see the image above? Click here
This is straight from the 10Q’s so there is no modeling here. As you can see, Pure has a majority of their revenue coming from U.S.-based customers. They have been slowly decreasing that dependence over time, from 77% to 72%, in the last 2.5 years. To have an understanding about how this compares to one of its peers, I highlight where Netapp is at in the same calendar quarter; Pure has a 21% higher dependency on U.S. based revenue than Netapp.
This leads me to wonder how the distribution of sales people is for Pure versus some of its peers.
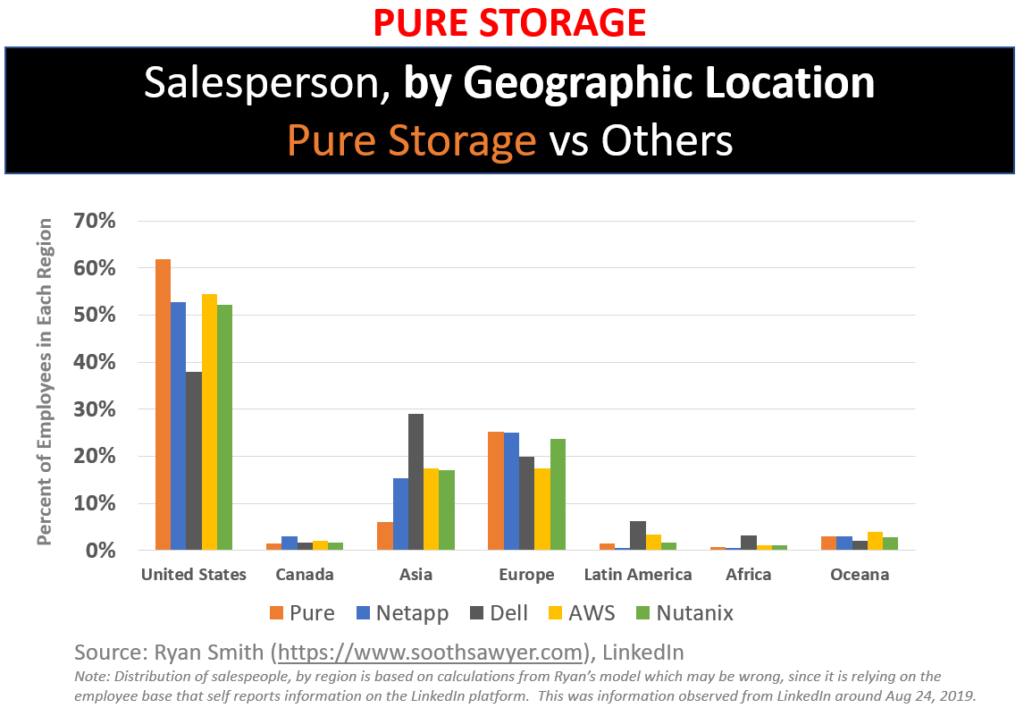
Can’t see the image above? Click here
According to the data I scraped from LinkedIn, it looks like Pure has a higher proportion of their salespeople in the United States. In Europe and Oceana, they seem proportionally represented versus their peers. And in the remaining regions, they fall below their peers. Again, keep in mind that this is based off of LinkedIn data which may differ from actual representation in each region for all companies listed.
According to some LinkedIn data I collected, from the beginning of June to mid-September, Pure looks to have hired another ~200 sales people in the U.S. and ~130 outside the U.S.
Just eyeballing it, I’m noticing that Pure Storage’s revenue percentage from the U.S. is higher than their employee percentage in the U.S., so there might be a discrepancy in the employee productivity in each region. Let’s take a look, and at the same time, compare it against Netapp.
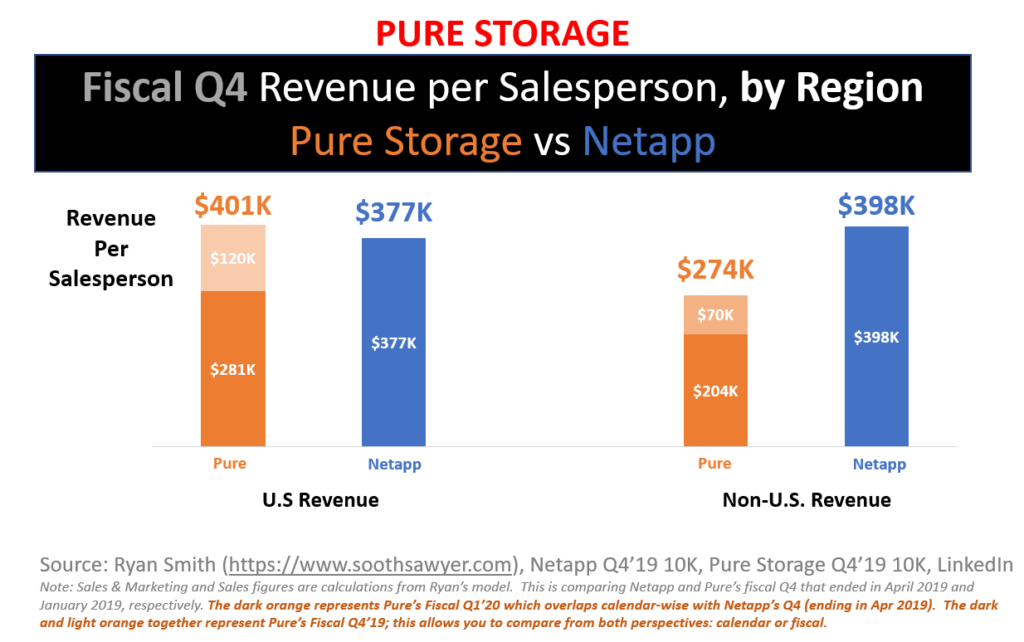
Can’t see the image above? Click here
I used the same dark/light orange breakdown to allow you to compare similar calendar or fiscal quarters, as I did earlier. For the purpose of my thoughts below, I will be looking at the combined dark/light orange to compare similar fiscal quarters (Q4).
Interestingly, it looks like Pure is slightly outperforming Netapp in the U.S. However, when looking outside the U.S., it looks like Pure is not performing anywhere close to Netapp. This could be an indication of less productivity of Pure’s international channel partners or some other issue. Or maybe my demographics are wrong? (for this analysis I used reported S&M employee counts and LinkedIn Sales/Marketing splits to come up with number of sales people)
As should be expected, it appears that expansion of international operations is important to Pure, based on this statement from many 10Q’s:
“In addition, we intend to expand and continue to invest in our international operations, which we believe will be an important factor in our continued growth.”
If my employee productivity analysis is correct, it makes it a tough proposition to scale international operations if the productivity is less than that of the U.S. Since overall revenue/employee is important to scaling a profitable enterprise, it seems like an easier decision to scale U.S. revenue to achieve operational profit.
Summary
As I have shown above, I believe employee productivity has been decreasing at Pure Storage over the past few quarters. If a larger portion of their sales are going to deferred revenue, this may not be a problem (I will try to take a look at that in a later post).
If there is an actual decline in productivity, it may be due to a large new sales population that isn’t as productive or it may be due to the inability to make their channel more independent. Or it might be due to the non-U.S. sales productivity. Or??
I believe it is important for Pure to increase their sales productivity due to their large sales & marketing expense, which is dominated by compensation (a variable expense).
The challenges I see going forward for Pure are the following:
- Lower international productivity preventing the necessary expansion needed
- Pure is benchmarking close to the productivity levels of Netapp; is it reasonable to expect it can grow this more?
- The decreasing customer per employee ratios lead me to believe there are issues ramping channel independence.
As always, I appreciate any feedback. I am not an expert in analyzing financial statements and am human and therefore can make mistakes. Please share your thoughts if you think I should be looking at things from a different perspective.
Please read my follow on parts of the deep dive that cover Stock-based compensation in detail and how much Sales & Marketing employees at Pure Storage are paid.
Ryan
A not-so quick disclosure: I work for various companies. However, this fact has nothing to do with this post because I have not been asked by anyone or any organization to analyze or publish my findings here with you. Others watch TV at night.. I watch data. And when I share my thoughts, they have no intent (so please don’t make up a story as to the intent) other than satisfying my urge to share ideas/thoughts..that’s it. I must also state that my views here in no way reflect that of my employer. Additionally, do not use any of this information to make financial decisions; treat this as for entertainment purposes only. The intent here is to see what kind of cool things easily available data can tell us, and this month it happens to be Pure’s financials. Additionally, Pure is an amazing company, just like all companies, and I wish them the best in their journey.

I have been around IT since I was in high school (running a customized BBS, and hacking) and am not the typical person that finds one area of interest at work; I have designed databases, automated IT processes, written code at the driver level and all the way up to the GUI level, ran an international software engineering team, started an e-commerce business that generated over $1M, ran a $5B product marketing team for one of the largest semiconductor players in the world, traveled as a sales engineer for the largest storage OEM in the world, researched and developed strategy for one of the top 5 enterprise storage providers, and traveled around the world helping various companies make investment decisions in startups. I also am extremely passionate about uncovering insights from any data set. I just like to have fun by making a notable difference, influencing others, and to work with smart people.