
In Part 1 of our Pure Storage Deep Dive, we explored Pure Storage’s (PSTG) revenue, expenses, operating margin, and headcount demographics that details their employee base as never explored before (If you didn’t read it yet, click here). In this part (Part 2), we are going to dive deeper into what makes up Pure’s largest expense: Sales & Marketing. In my next post, we will then combine what we have learned based on Part 1 and Part 2 to then look at productivity and trends on a per sales employee (Part 3) and per customer basis.
In Part 5, we take this post and divide it amongst all the Sale and Marketing employees to find out how much Pure is compensating it’s employees.
Please read my entire disclosure at the bottom of this post. A quick version: I work for various companies, although this post has absolutely nothing to do with my employment there.
My analysis of their Sales & Marketing expense will be non-GAAP and including SBC (stock-based compensation); see my last post to see the discussion around this.
Pure Storage does not state the itemized breakdowns of what comprises their S&M expense. Instead, they simply provide a total S&M figure and then provide comments on year-over-year (YoY) changes in different categories, such as: employee compensation, stock-based compensation, commission, marketing, travel, office, and outside services. Lucky for us, by simply aggregating all of these footnote YoY figures, we can start to see what Pure’s S&M expenses look like:
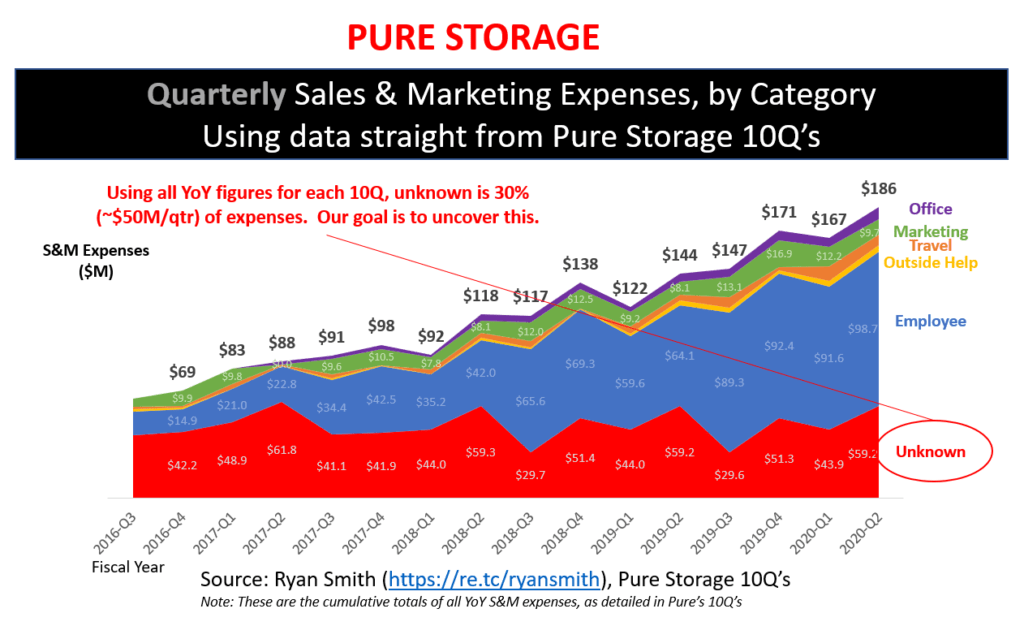
Can’t see the image above? Click here
However, look at that Unknown category. That is basically Pure’s reported total S&M expenses minus the cumulative total of all YoY figures, by category. Pretty cool huh? We were able to see a majority what makes up their S&M expenses by doing some simple addition of all their YoY’s over time. Although, not knowing the remaining 30% (~$50M/quarter) bugs me, so let’s dig more.
Upon inspecting some early 10K’s (their year-end financial statement), Pure posted their year-end YoY figures, further revealing more of where their expenses lie; The only problem is that these were yearly figures so I didn’t know the exact quarter in which they were distributed. I knew all YoY figures for all S&M categories from Q3’FY16 and beyond. I also had the total FY16 YoY numbers so I simply distributed the remaining across Q1/Q2’FY16. For FY15, I just threw it across the quarters, evenly. Based on all this, I came up with the following..again, keep in mind that my quarterly distribution could be off.. But the total (especially a Q4 12-mo rolling version of this) would correctly distribute across categories. For my actual model of Pure’s S&M expenses in the next section, I get a little more sophisticated than just distributing the unknown evenly. But I wanted to show you what can be done, with the least amount of effort.
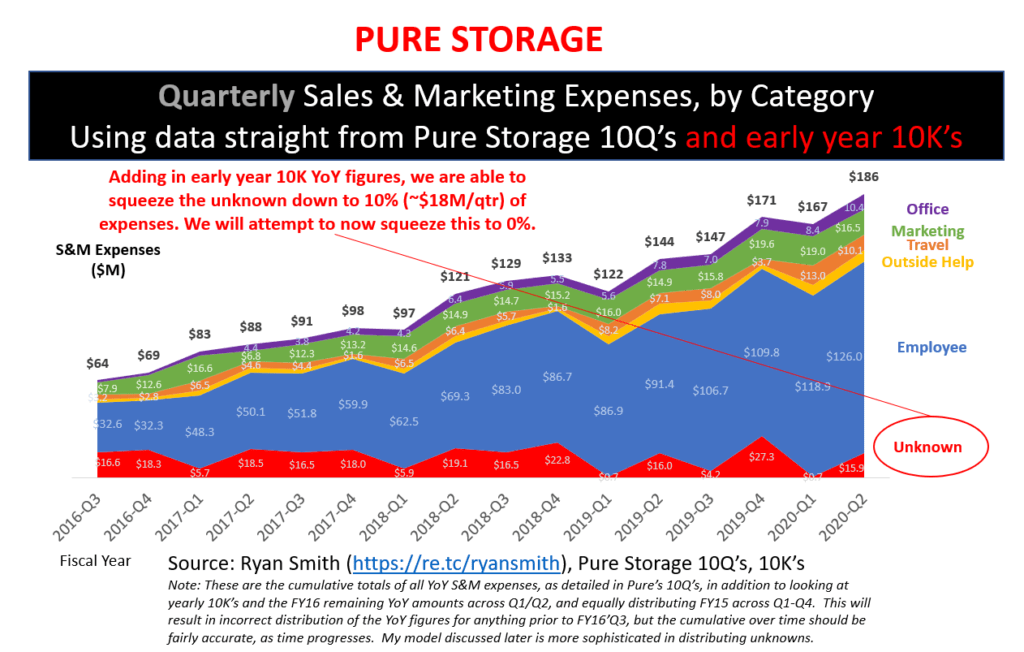
Can’t see the image above? Click here
Wow, we got it down to 10% (~$20M/quarter) of unknown expenses. So, now we have a pretty good idea of where Pure spends its Sales & Marketing dollars today. However, 10% is bugging me. Let’s go for 0%.
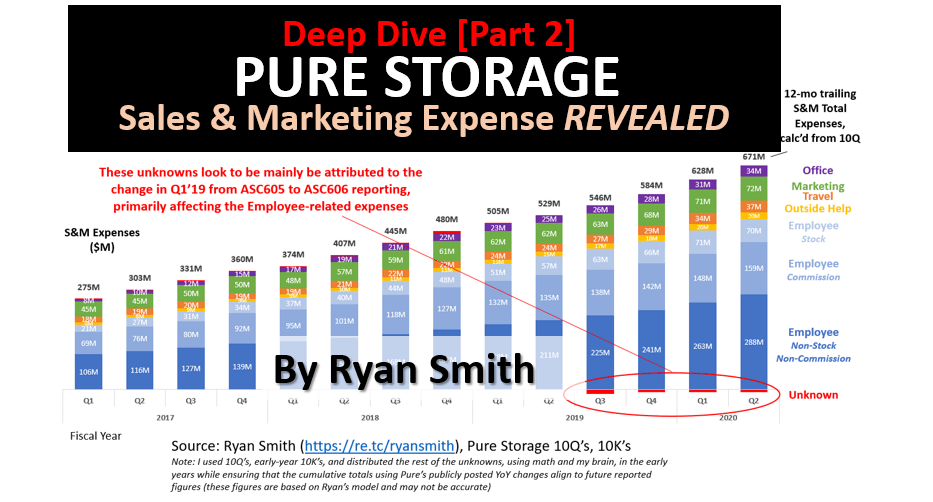
Ryan’s model of Pure Storage Sales & Marketing Expenses
To do this, I had to get a little more sophisticated (using math and Sudoku-like skills) by looking at trends across quarters and categories so that all future total projections aligned with all publicly reported YoY and total S&M expenses; this is harder than it seems.
In the chart below, you will see the red portion, labeled “Unknown” that shows you how my model differs from the total reported by Pure Storage. However, note that you really don’t see any significant unknowns (red) until Q1’19 and beyond. This actually appears related to a change Pure went thru in their financial reporting (going from ASC605 to ASC606). If you were to remove the differences caused by this change, my model would be pretty damn close (+/- 2% for aligning to totals as publicly reported, across all quarters).
Can’t see the image above? Click here
As mentioned above, prior to FY2019, Pure reported all their figures using ASC605; Starting in FY2019, they changed over to ASC606. This primarily has to do with revenue and expense recognition and mainly appears to impact employee-related compensation. I did not do anything to address the differences in reporting across quarters. In looking at the significance of this omission to my model, the difference in reporting can cause a +/- $5M difference in S&M expenses, with occasional anomalies above that. In other words, not worth me diving into deeper.
You will also note that I broke up the Employee-related expense into three further categories (stock-based, commission, and the rest: salary, etc). The stock-based compensation should be spot on since Pure actually covers that expense in detail in their SEC reports. The commission and salary we calculated based off of the YoY sudoku-like karate moves).
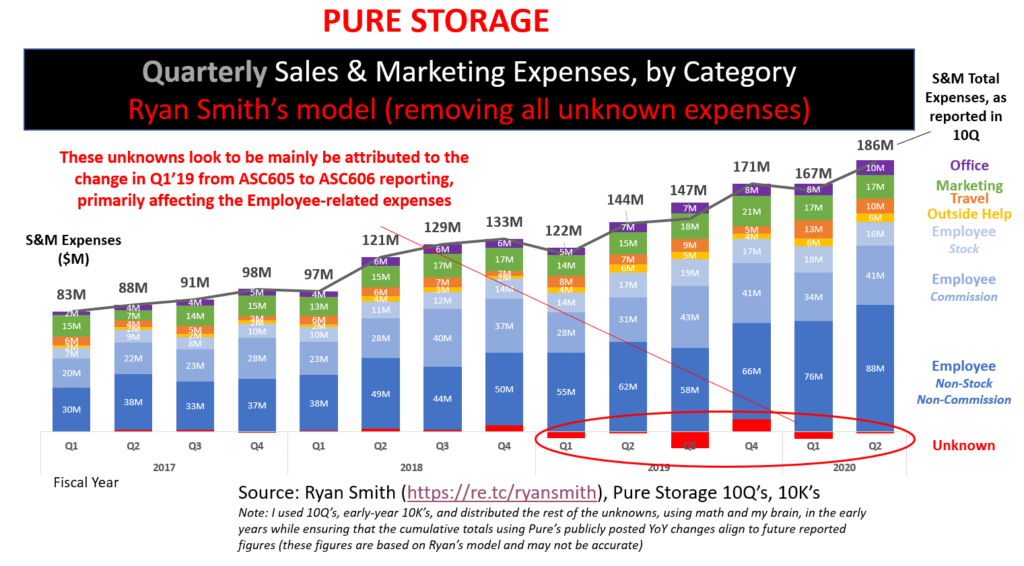
As I’ve said in previous posts, I like to look at 12-mo trailing to remove seasonality so here is that view:
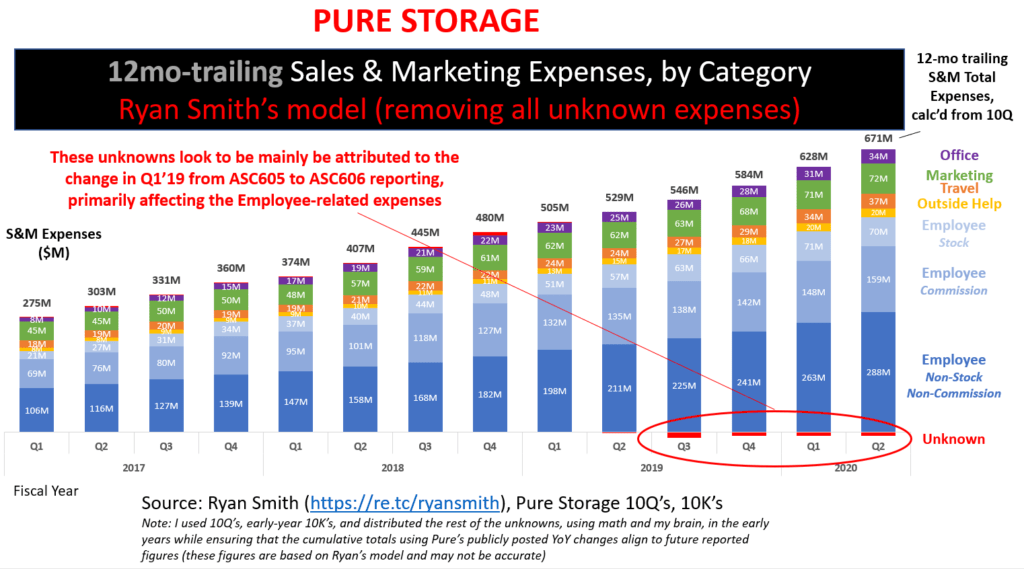
Can’t see the image above? Click here
Well, there you have it. This is my model of what I believe Pure Storage’s Sales & Marketing is spent on. If you see any problems in my analysis, please share your thoughts. I am human and can make mistakes.
Part 1 and Part 2 are build-ups (prerequisites) for my next post (Part 3), where we will take the employee headcount breakdown (from Part 1) and the Sales & Marketing (from Part 2; this part) and start to look at productivity related trends to see what it tells us. From there, we will finally look at different scenarios of profitability based on different assumptions.
Until Post 3, (Update: Part 3 is now posted which covers the declining revenue per employee trend, as well as more sales demographic info)
Part 5 takes a look at the above figures, divides it by the number of sales and marketing employees, and uncovers how much each employee is getting compensated.
A not-so quick disclosure: I worked for a competitor of Pure Storage when I wrote this. However, this fact has nothing to do with this post because I have not been asked by anyone or any organization to analyze or publish my findings here with you. Others watch TV at night.. I watch data. And when I share my thoughts, they have no intent (so please don’t make up a story as to the intent) other than satisfying my urge to share ideas/thoughts..that’s it. I must also state that my views here in no way reflect that of my employer. Additionally, do not use any of this information to make financial decisions; treat this as for entertainment purposes only. The intent here is to see what kind of cool things easily available data can tell us, and this month it happens to be Pure’s financials. Additionally, Pure is an amazing company, just like all companies, and I wish them the best in their journey.

I have been around IT since I was in high school (running a customized BBS, and hacking) and am not the typical person that finds one area of interest at work; I have designed databases, automated IT processes, written code at the driver level and all the way up to the GUI level, ran an international software engineering team, started an e-commerce business that generated over $1M, ran a $5B product marketing team for one of the largest semiconductor players in the world, traveled as a sales engineer for the largest storage OEM in the world, researched and developed strategy for one of the top 5 enterprise storage providers, and traveled around the world helping various companies make investment decisions in startups. I also am extremely passionate about uncovering insights from any data set. I just like to have fun by making a notable difference, influencing others, and to work with smart people.