
According to price trackers, the pricing of NAND Supplier-based SSDs has begun to decline; In fact, the decline began in August 2017! Let’s dig in..
Today, the pricing of PC-based 1TB SSDs is already at $0.29/GB. You can confirm this by looking at Amazon.com. ($299 divided by 1,024GB = $0.29/GB)
Extrapolating the Enterprise-class pricing (section on this below), we should be looking at today’s Enterprise-based SSDs at $0.31/GB. However, the market and the perceived on-going shortage may command higher prices.
By the end of 2018, I expect SSD pricing to be between $0.21/GB and $0.23/GB.
Read on for more details..
Comparing $/GB to Supply/Demand Ratios
I wanted to map today’s SSD pricing, as well as the historical pricing of SSDs to the supply/demand ratio of NAND Flash to see whether there is a correlation, whether we are in fact out of a shortage, and predict where future pricing is going.
To do this, I needed to pick a Flash supplier that wouldn’t just be dumping Flash at a low price in the channel/retail (I want some visibility on all SSD market segment pricing trends) and find an actual SSD model that had some good historical pricing data to analyze. Based on some recent Analyst reports, the largest vendor had a ~40% M/S of a roughly $4B channel/retail SSD market and the next biggest competitor was at ~10% M/S. From a market share perspective (in the retail segment, and all other segments), the largest vendor seems like the only supplier to safely assume they wouldn’t lower pricing here unless the Flash market had loosened up in general. Furthermore, it would be safe to assume that in a shortage, any Flash supplier would not be selling their channel/retail SSDs at a lower price than they could command in other segments they serve. For the largest vendor, that would be a lot of Flash to have lower pricing than they could command elsewhere, with the large market share they have in every segment. Looking at the largest vendor’s SSD models, their popular 1TB drive has been in the market for a while so the price tracking data is pretty solid. Hence, I picked their popular 1TB drive. So, let’s take a look..
Pricing Tracker Data for this 1TB SSD (uses 48-layer TLC 3D-NAND according to the SSD Review):
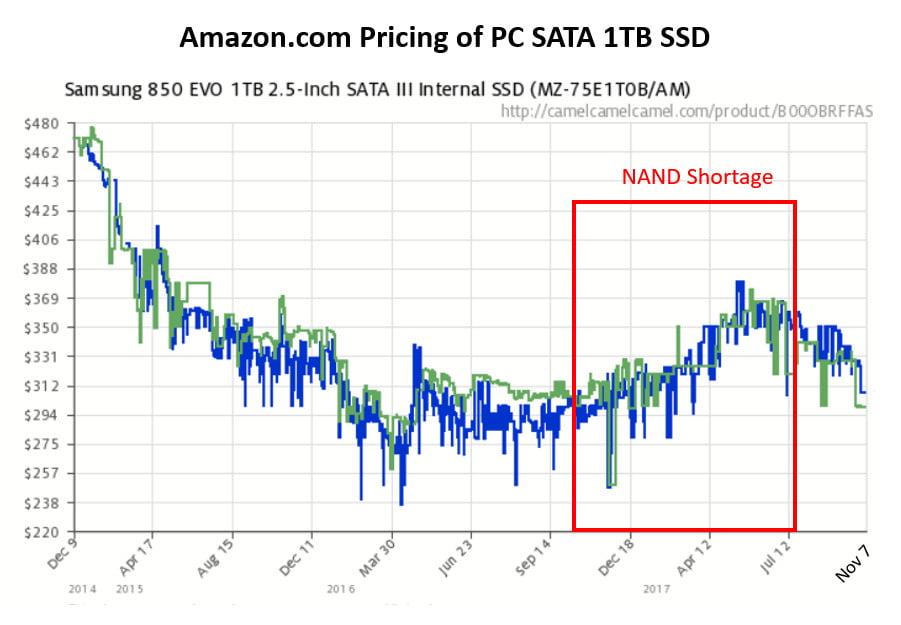
The price increases on this 1TB SSD happens to coincide with the Flash shortage. This is of no surprise and should be expected. But take a look at the price declines since the August time frame. Why would any supplier lower their pricing when they can command higher pricing in a tight market? If the market is tight, I would rather be selling that Flash at a higher ASP; why keep lowering the price since August? Interesting.
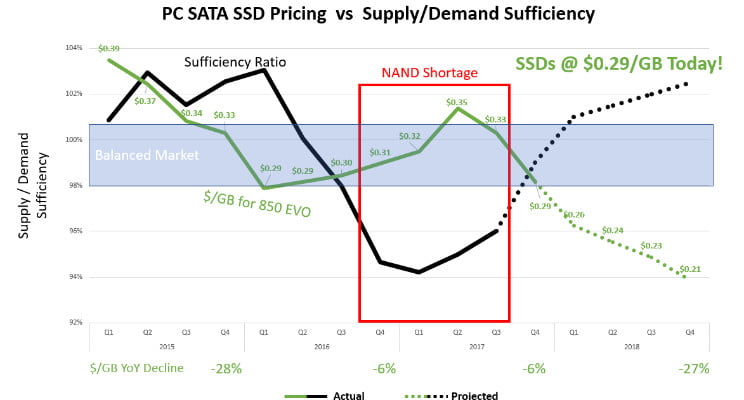
Taking the price tracking data above, converting it to raw $/GB, and mapping against the supply/demand curve (I looked at a few analysts predictions and blended and used a “Meritage”), you can start to see an inverse correlation between the supply/demand ratio and the $/GB of PC-based SSDs. As a side note (and something I didn’t look into), you would likely want to take the percentage above a balanced market and correlate that to the price % decline; this is because when you are oversupply, you should expect a continual price decline.
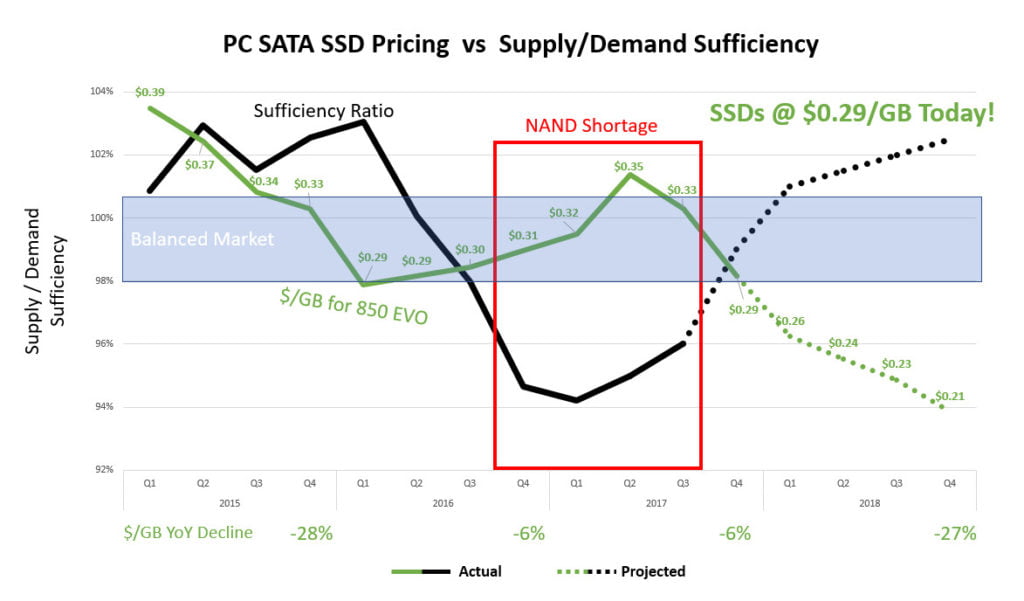
Actually, let me reverse (flip) the $/GB (see below chart) since there is an inverse relationship between the supply/demand ratio and the $/GB. This makes it easier for you to see the correlation. Just keep in mind that when you see the price moving up in the below chart, it’s actually declining; I put the $/GB on the line to make it easier to keep your head around that. The below chart is the same as the chart above but with the inverse $/GB.

Ahhh, that’s much easier to see the correlation. Based on the Q3’17 (last quarter) Supply/Demand Ratio, pricing and supply is improving. And that maps nicely to the actual price decline we saw on this SSD in Q3’17. Furthermore, November (Q4’17; this month) pricing of this SSD shows further actual declines to $0.29/GB and this matches the predicted S/D ratio improvement that is currently projected for Q4’17. Coincidence?
Based on the chart above, the corresponding correlations, and the analysts’ predictions of supply/demand, I am expecting pricing of PC-based SSDs to approach $0.21/GB by the end of 2018, based on the expected 2018 YoY $/GB decline of 27%.
Enterprise SSD Pricing vs. Supply/Demand
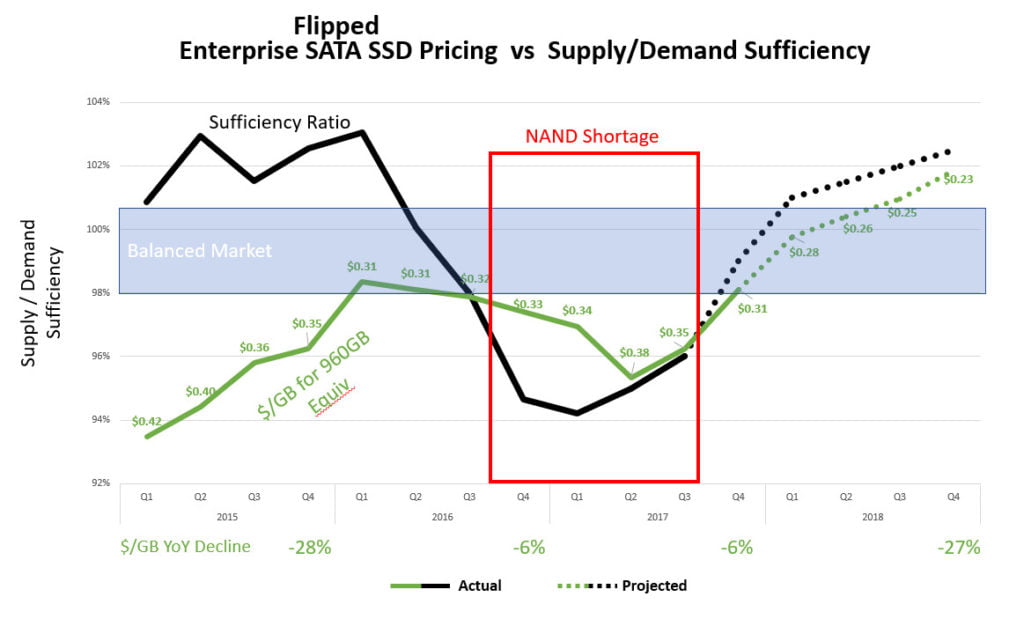
Next, let’s look at the Enterprise world. I’m going to do a similar chart below for the commonly provided 7% over-provisioned drives I am seeing in the Enterprise space today (e.g., 960GB, 1.92TB, 3.84TB). To do this, I simply take the PC-based SSDs and adjust the capacities by 7%. Keep in mind that this pricing is extrapolated off of the PC-equivalent drive and may not reflect whatever the market thinks it should be paying for the drive. Based on this, Enterprise SATA drives should be around $0.31/GB today. The trend will be the same as the PC-based trend but with an elevated $/GB.
Extrapolated Enterprise SSD Pricing vs Supply/Demand Ratio:
In summary
Today’s SSD pricing: PC SSDs: $0.29/GB / Enterprise: $0.31/GB (extrapolated)
2018 (End) SSD pricing: PC SSDs: $0.21/GB / Enterprise: $0.23/GB (predicted)
SSD Vendors are lowering their SSD pricing in the channel/retail market as indicated by publicly-available pricing trackers; this has been going on for two to three months now. Mapping NAND Flash supply/demand ratios to these price declines shows a correlation between the two. Even though Q4’17 S/D ratios aren’t historical yet, the current prediction maps closely to the actual Q4 pricing already being seen today. Based on predictions of where the Flash market supply/demand is heading, you should expect the price declines to continue and if your segment (non-channel/retail) hasn’t seen these price declines, expect it soon after customers realize the shortage has already ended.
Enjoy!

I have been around IT since I was in high school (running a customized BBS, and hacking) and am not the typical person that finds one area of interest at work; I have designed databases, automated IT processes, written code at the driver level and all the way up to the GUI level, ran an international software engineering team, started an e-commerce business that generated over $1M, ran a $5B product marketing team for one of the largest semiconductor players in the world, traveled as a sales engineer for the largest storage OEM in the world, researched and developed strategy for one of the top 5 enterprise storage providers, and traveled around the world helping various companies make investment decisions in startups. I also am extremely passionate about uncovering insights from any data set. I just like to have fun by making a notable difference, influencing others, and to work with smart people.