
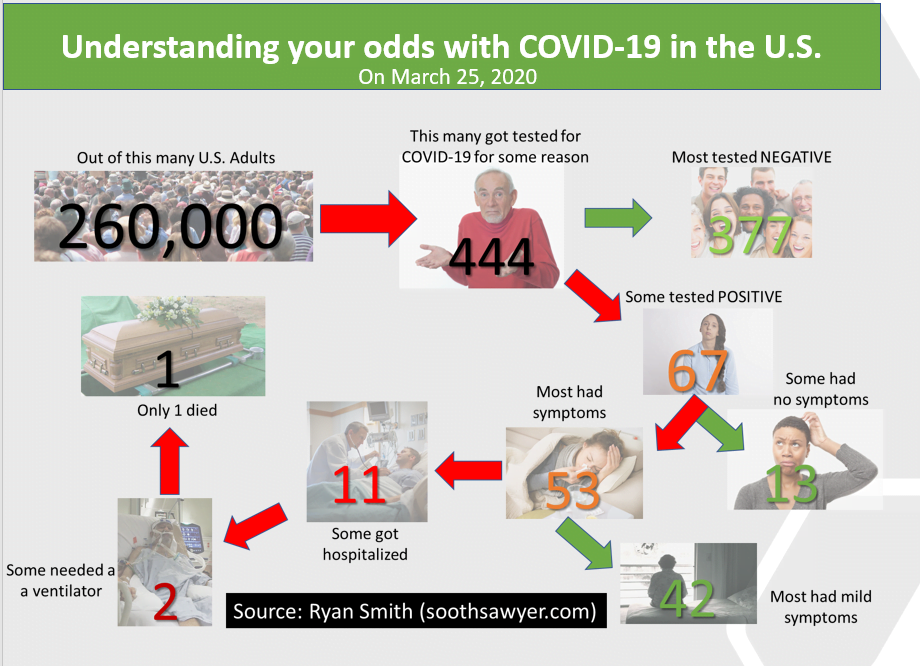
When it comes to COVID-19, it can be hard to understand how all these percentages and statistics you hear on the news are relevant to you. For this reason, I thought I’d create a simple illustration based on where things are at in the U.S. (based on my understanding of today’s figures, as outlined in the assumptions). To put it another way, this not a forecast and instead is illustrating what today’s data looks like in an easier to interpret way. I did not make up my assumptions but they are based off of research on the web. Enjoy!
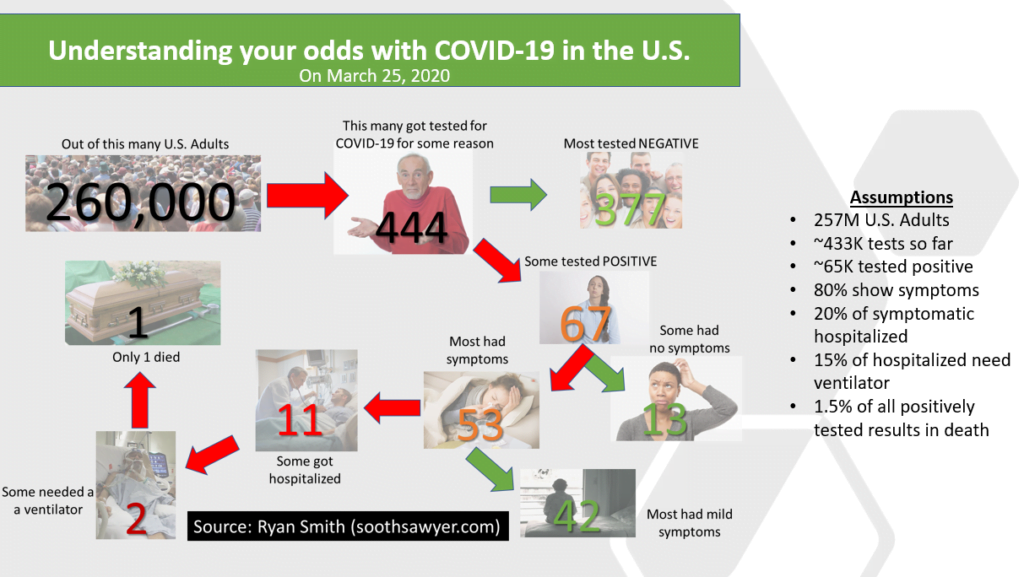
Want a larger version of the above Understanding COVID-19 illustration? Click here
Any questions? Just ask.
Ryan

I have been around IT since I was in high school (running a customized BBS, and hacking) and am not the typical person that finds one area of interest at work; I have designed databases, automated IT processes, written code at the driver level and all the way up to the GUI level, ran an international software engineering team, started an e-commerce business that generated over $1M, ran a $5B product marketing team for one of the largest semiconductor players in the world, traveled as a sales engineer for the largest storage OEM in the world, researched and developed strategy for one of the top 5 enterprise storage providers, and traveled around the world helping various companies make investment decisions in startups. I also am extremely passionate about uncovering insights from any data set. I just like to have fun by making a notable difference, influencing others, and to work with smart people.